Warehouse · Case Study
Storio Elmina: Digital Power Meters for an Automated Warehouse
Storio's automated hub at Elmina runs mainly on motor load, not lighting, so maximum demand drives its bill. Digital power meters feeding CobiNeural support demand attribution, GBI NRNC Silver evidence and a 24% energy reduction target. Completing October 2026.
Storio's automated warehouse at Elmina runs mainly on motor load rather than lighting, so maximum demand is the largest factor in its electricity bill. Cobler, working with Cape Renewables Sdn Bhd, is installing digital power meters that feed CobiNeural. They will show which subsystem causes each peak, provide evidence for the site's GBI NRNC Silver target, and measure progress against its 24% energy reduction target. Implementation is scheduled for completion in October 2026.
The site
A conventional warehouse spends most of its electricity on lighting and air movement. Storio's does not, and that changes the energy problem.
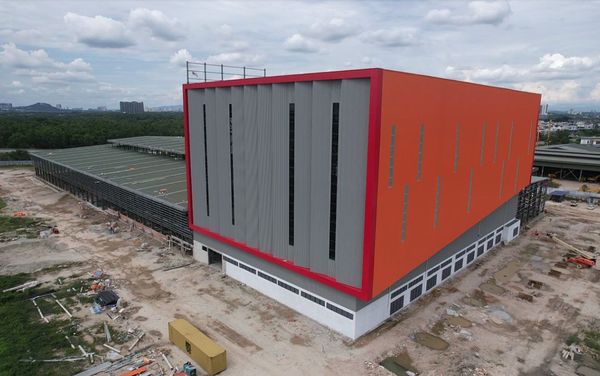
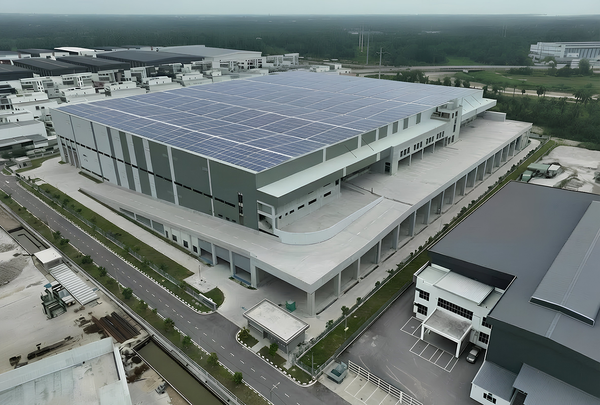
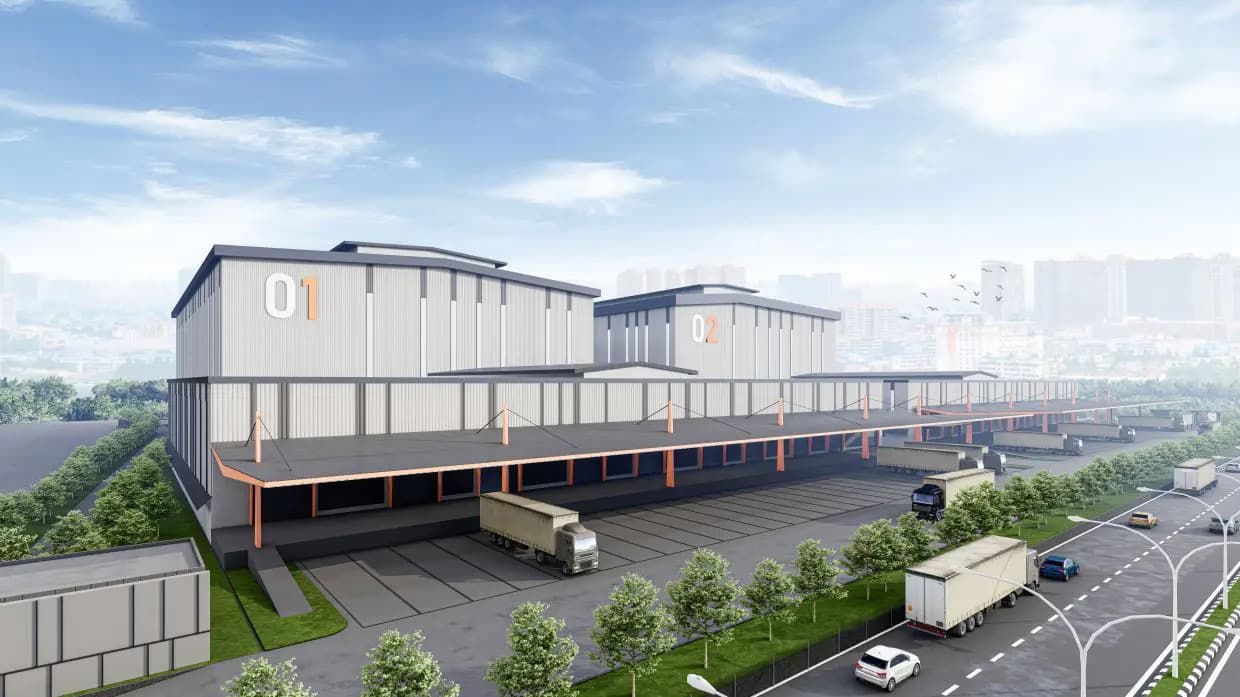
Storio Sdn Bhd is the operator and master tenant of the Exio Logistics Hub at Elmina East, in the City of Elmina, Selangor. Publicly announced figures describe two facilities, Storio Hub 1 and Hub 2, across 22 acres and roughly 500,000 square feet. They are built to hold 117,000 pallet positions and move 240 pallets an hour. The operation uses AI and robotics for automated storage and retrieval: stacker cranes, automated guided vehicles (AGVs), conveyor lines, roller lifts and palletisers work tall racking at a pace a manual operation cannot match.
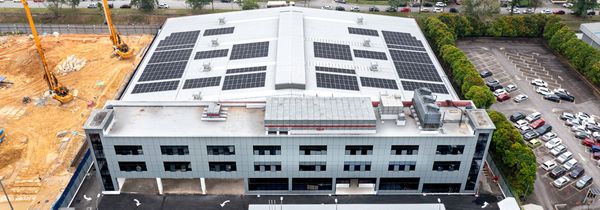
The development is targeting GBI NRNC Silver (the Green Building Index rating for Non-Residential New Construction) and LEED v4 Gold. It has an 815 kWp (kilowatt-peak) solar photovoltaic system, and it states an aim of a 24% reduction in energy consumption compared with a conventional warehouse. Each of these targets needs measurement before it needs engineering. A 24% reduction is not a design feature. It is a claim, and a claim needs instruments to back it.
Automating a warehouse reverses its load profile. Lighting drops away, because robots do not need to see. Motor load replaces it, and motor load behaves very differently from lighting. It comes in sharp spikes, many motors run together, and it follows throughput rather than opening hours.
The problem
In an automated warehouse, demand drives the bill
Storio's team focused on maximum demand from the start, and they were right to.
Under RP4, the Tenaga Nasional Berhad (TNB) tariff structure effective 1 July 2025, demand is billed through Capacity and Network charges. For the relevant medium-voltage (MV) categories these currently total RM89.27 per kW (MV General) and RM97.06 per kW (MV Time of Use, where only the 2pm to 10pm weekday peak window counts). The charge is set by the single highest half-hour peak in the month. Consumption is the energy you use. Demand is how hard you drew power at your worst moment, and you pay for that moment for thirty days.
An automated facility can easily create that moment. Stacker cranes accelerating with loads, conveyor lines starting together and AGVs charging while the system runs at full rate can push one busy half hour far above the average. None of this is visible on a monthly invoice. Two facilities moving the same annual volume can pay very different demand charges, depending only on whether their movements are spread out or bunched together.
Because the peak comes from the schedule, it can be managed, which is why it is worth measuring. That only works if the peak can be traced to a cause. A single incoming meter shows that a peak happened. It does not show which subsystem caused it, or whether the same combination will happen again tomorrow.
Solar does not solve the peak
Rooftop solar makes this more complicated. Maximum demand is measured on what the site draws from the grid, so the 815 kWp array only reduces the peak when solar generation happens at the same time as the peak. A throughput peak at two in the afternoon gets real help. The same peak at nine in the evening gets none. A facility that runs to a fulfilment schedule rather than a solar one can easily set its monthly maximum after dark. Knowing which case applies needs interval data from both sides of the meter.
Certification needs evidence
The second driver is certification. The facility is pursuing GBI (Green Building Index) certification, Malaysia's homegrown green building rating tool. GBI assesses buildings across six criteria, including Energy Efficiency. Its sub-metering criterion exists so that consumption can be monitored, on the basis that nobody can run a building efficiently without seeing how it performs. Certification needs evidence, and evidence needs instruments. The same instruments that satisfy the assessor will later show whether the 24% target was met.
What we installed
Cobler is delivering the work with Cape Renewables Sdn Bhd, in two parts: the energy management system (EMS) panel and Modbus gateway that form the data backbone, and the termination of the digital power meters (DPMs) that feed it.
The meters are placed according to where the building spends money, not simply how its single line diagram is drawn:
- The incomer first, to give a verifiable total that reconciles with the TNB bill.
- Then the loads that set the peak, so a demand event can be traced to a subsystem and a point in the throughput schedule, rather than to the site as a whole.
- Current transformer (CT) ratios sized to measured running current, not to the breaker rating. This matters more in an automated facility than a conventional one, because motor loads swing sharply between idle and full rate. A CT chosen from the breaker size will read the busy half hour well enough and the rest of the day as noise.
- Modbus RTU over RS-485 into the EMS panel gateway, feeding CobiNeural as the energy management system above the meters.
Implementation is scheduled for completion in October 2026.
Working within a live construction programme
On a project like this, metering comes near the end of a long chain. The EMS panel, the gateway and the DPM terminations all depend on the switchgear being energised, the boards being final, and the automation contractors being far enough along that what is measured is what will actually run.
That makes the schedule, rather than the engineering, the main thing to manage. Work windows get shorter, so the practical approach is to keep independent tasks moving:
- install the panel and gateway ahead of the meter terminations
- confirm the metering points against the final board schedule, not the tender drawings
- prepare the documentation alongside the physical work, not after it
For anyone specifying an EMS within a construction programme, the lesson is to fix the metering schedule and the documents at kickoff. At that stage the board schedule is still being finalised, and adding a metering point costs a drawing revision rather than a site visit.
What it gives Storio
- Insights → Energy tracks consumption, power factor, energy use intensity and the Max Demand KPI (key performance indicator) by site and by equipment, at interval resolution. A peak can be traced to a subsystem and a moment, not just to a month.
- Alerts sends anomalies by WhatsApp or email. Equipment running while the system is idle is noticed the same day.
- Reporting produces the documented, repeatable output that GBI evidence needs, and that any later Energy Efficiency and Conservation Act (EECA) or ISO 50001 work will depend on, from a record that is auditable by design.
- Where the data shows a repeatable, schedule-driven peak, the team can reschedule the movements that cause it. Staggering them through the site's controls would be a separate automation project.
Where the project stands
Installation is ongoing, with implementation scheduled for completion in October 2026.
Once complete, Storio will see demand as it forms rather than after it is billed, and trace each peak to the subsystem and moment that caused it. It will have the evidence its GBI NRNC Silver submission expects, and the instruments to test its own 24% energy reduction target rather than simply state it. In a facility where throughput drives the peak and the peak drives the bill, this is what lets the team manage that half hour instead of just paying for it.
See how other warehouse operators approach this, or talk to us about metering your facility.
Ready to achieve similar results?
Let's discuss how CobiNeural can transform your energy management.