275 George Street, Australia: Energy Monitoring and Sub-Metering
275 George Street, a commercial building in Australia, deployed CobiNeural for energy monitoring and sub-metering, turning a single supply point into a continuous, area- and system-level view of consumption.

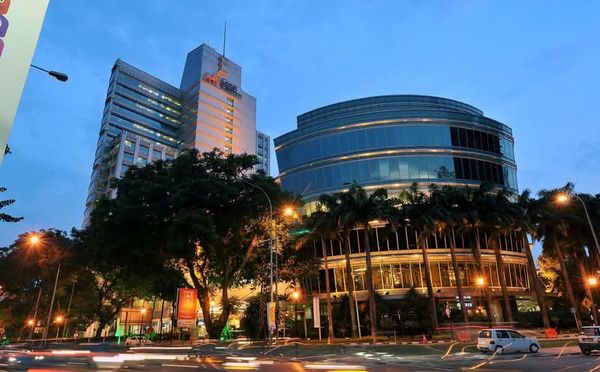
275 George Street is a commercial office building in Australia, and a working proof that CobiNeural travels well beyond its home market. The brief was one Cobler's Malaysian clients would recognise immediately: see energy clearly, down to the level that actually lets you act on it. Whole-building consumption tells you what you spent. It does not tell you where, when, or why.
About the client
275 George Street is a commercial property where energy is both a major operating cost and a tenant-facing responsibility. Buildings like this run the usual mix of large loads: central chillers, air-handling units, lighting, lifts, and tenant fit-outs that each pull power on their own schedule. The site manager's problem is not a lack of data so much as a lack of resolution. A single utility meter at the boundary aggregates everything into one number, which is the wrong unit of measure for a building made of many independent systems and occupants.
The challenge
Whole-building energy data was not enough. The team needed sub-metered visibility to understand how different areas, floors, and systems consumed power across the building. Without it, the everyday questions have no clean answer. Which floor or plant is driving the bill? Is the chiller running outside occupied hours? Did a recent fit-out change a tenant's load profile? When the only signal is one aggregate figure, an anomaly hides inside the total until it shows up as a higher invoice, and by then the cost is already incurred.
Sub-metering is also the foundation for anything that comes after it. Cost allocation, demand management, and verifying that an efficiency change actually worked all depend on being able to measure consumption at the level where decisions are made, not at the level where the utility happens to bill.
The solution
CobiNeural delivers energy monitoring and sub-metering across the property, turning a single supply point into a detailed, continuous view of consumption. The platform organises the building the way an operator thinks about it: the site breaks down into locations and zones, those into equipment, and equipment into the sensors and meters that report against them.
The modules that map to this deployment:
- Insights -> Energy carries the core of the work: consumption, demand, power factor, and energy use intensity, tracked at location and equipment level rather than as one building total. The same view surfaces the Max Demand KPI, the metric that drives a large share of commercial energy cost.
- Insights -> Equipment extends that resolution down to individual systems, so chillers, pumps, and other major loads are sub-metered in their own right instead of being inferred from the aggregate.
- Dashboards pull the picture together into views the site team can read at a glance, and that a portfolio owner can compare across properties.
Because CobiNeural deploys standalone or as an intelligent overlay on existing BMS and metering infrastructure, the building did not have to be re-instrumented from scratch to gain this visibility. The platform sits on top of what is already there and makes it legible. For sites that want to move from monitoring to control, the same data layer feeds automation actions, but visibility is the prerequisite, and that is what this project established first.
The result
275 George Street gained granular, real-time energy visibility for a commercial building on the other side of the region, the same monitoring foundation Cobler's Malaysian clients rely on. The single boundary meter became a sub-metered map of the building: consumption resolved by area and by system, demand visible as it happens, and a baseline that any future efficiency work can be measured against.
That resolution is what makes the rest possible. Once you can see consumption at the level you manage it, surges stop hiding in the total, off-hours waste becomes obvious, and cost can be attributed to the floor or tenant that actually drove it. It is the difference between reading a bill and running a building.
See how the same approach has played out across other CobiNeural deployments. If your building is still managed from a single utility number, talk to us about what sub-metered visibility would show you.
Ready to achieve similar results?
Let's discuss how CobiNeural can transform your energy management.