Blog
Trends, Alarms and Dashboards: The Operator's Window Into the Building
How a BMS shows operators the building through trend logs, alarms and dashboards, why alarm floods can bury the one that matters, and the override trap.
 Tan Kok XinBuilding Automation & BMS Fundamentals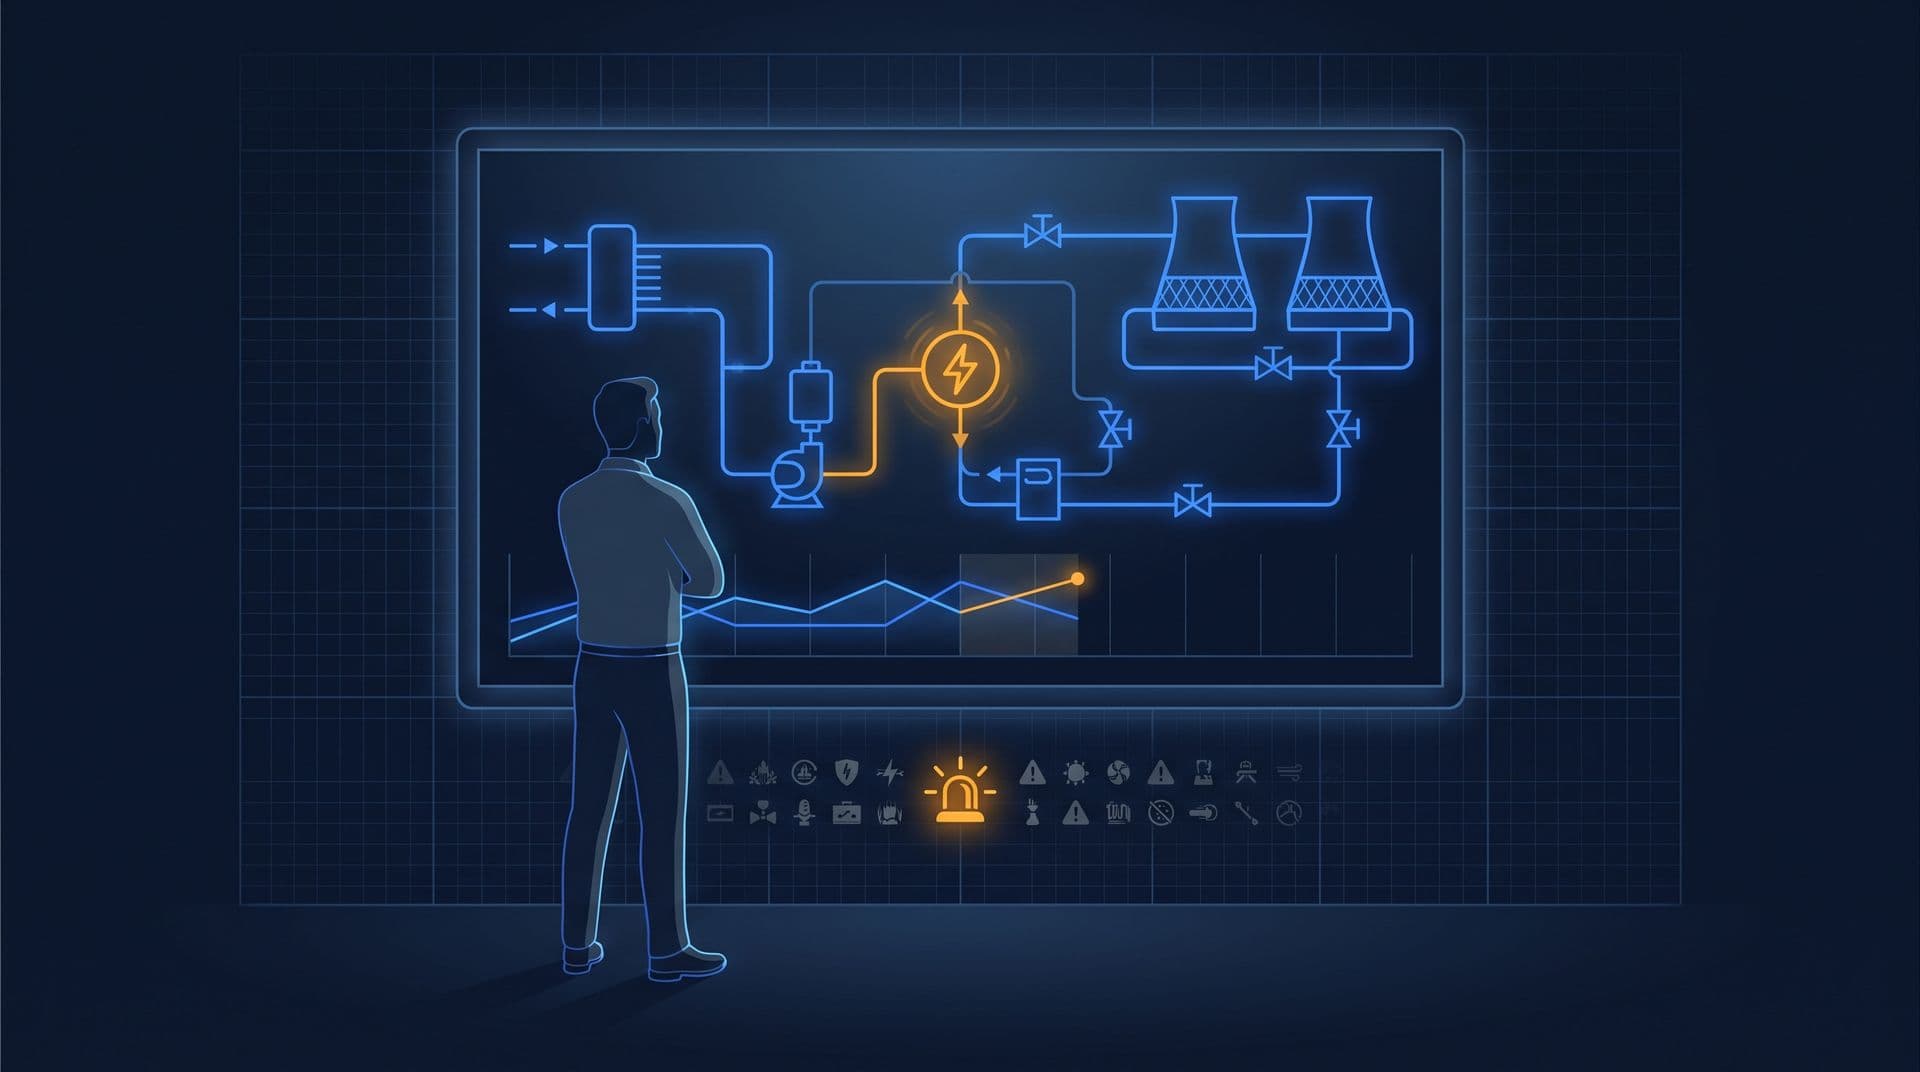
Part 8 of 16 in Cobler's Building Automation and BMS Fundamentals course. New here? See the course page.
Part 7 set up schedules, setback and optimum start that run on their own, mostly when nobody is watching. That left a question: how would you know whether level 12 east really reached 24 °C by 8am, or whether AHU-12A ran all night? A facility manager in the office tower cannot stand next to every pump at 3am or feel every duct on every floor.
The building management system (BMS) gives the operator views of the building on a screen, much as a car's dashboard has a speedometer for now, warning lights for faults and a trip record to look back on. It records trends, raises alarms and shows live graphics. These answer three questions: what happened, what is wrong right now, and what is going on at this moment? This part explains each one, shows how to read a trend to find the cause of a problem on AHU-12A, and then covers the two habits that most often undo all three: alarm floods and forgotten manual overrides.
Trends are the building's memory
A trend log (the store of trend logs is often called the historian) is the BMS recording the value of a point at regular intervals, for example every minute or every fifteen minutes, and keeping that history. A point, as Part 3 explained, is any single measured or commanded value: a temperature, a fan's status, a valve position, a floor's power draw.
Without trends, every question about the past gets a shrug. Suppose level 12 east was warm yesterday afternoon. With trends, the operator puts AHU-12A's supply air temperature and its chilled water valve position on the same graph. If the temperature climbed while the valve was already fully open, the control loop was not the problem: the coil was not getting enough cooling. That diagnosis came entirely from history, and the next section shows how to make it.
Trends also reveal slow problems that no single reading shows: a chiller that takes a little longer to reach its setpoint each week, or a pump drawing slightly more current month after month. They also answer the question from Part 7: a trend of level 12 east's zone temperature shows whether it reached 24 °C by 8am, and a trend of AHU-12A's fan status shows whether it ran all night.
Good trending is planned. Storage and network capacity are limited, so a well-commissioned BMS trends the points that matter (key temperatures, statuses, valve positions and energy) at sensible intervals. Which points, how often and how long to keep them are commissioning decisions. When nobody makes them, a building discovers on the day it needs history that nobody was recording it.
Reading a trend: bad sensor, bad control or broken machine?
When a floor is too warm or too cold, there are three common kinds of cause:
- A bad sensor: the controller is acting on a wrong reading.
- Bad control: the reading is right, but the loop's settings make it behave badly.
- A broken machine or supply: the controller asks for the right thing, but the equipment cannot deliver it.
A trend can usually tell these apart, as long as you put three things on the same graph: the measurement the loop controls (AHU-12A's supply air temperature), what the controller is doing about it (the chilled water valve position), and a second, independent measurement of the result (the return air temperature, which shows how warm the floor itself is). Here are three worked examples on AHU-12A, whose supply air setpoint is 14 °C (Part 5).
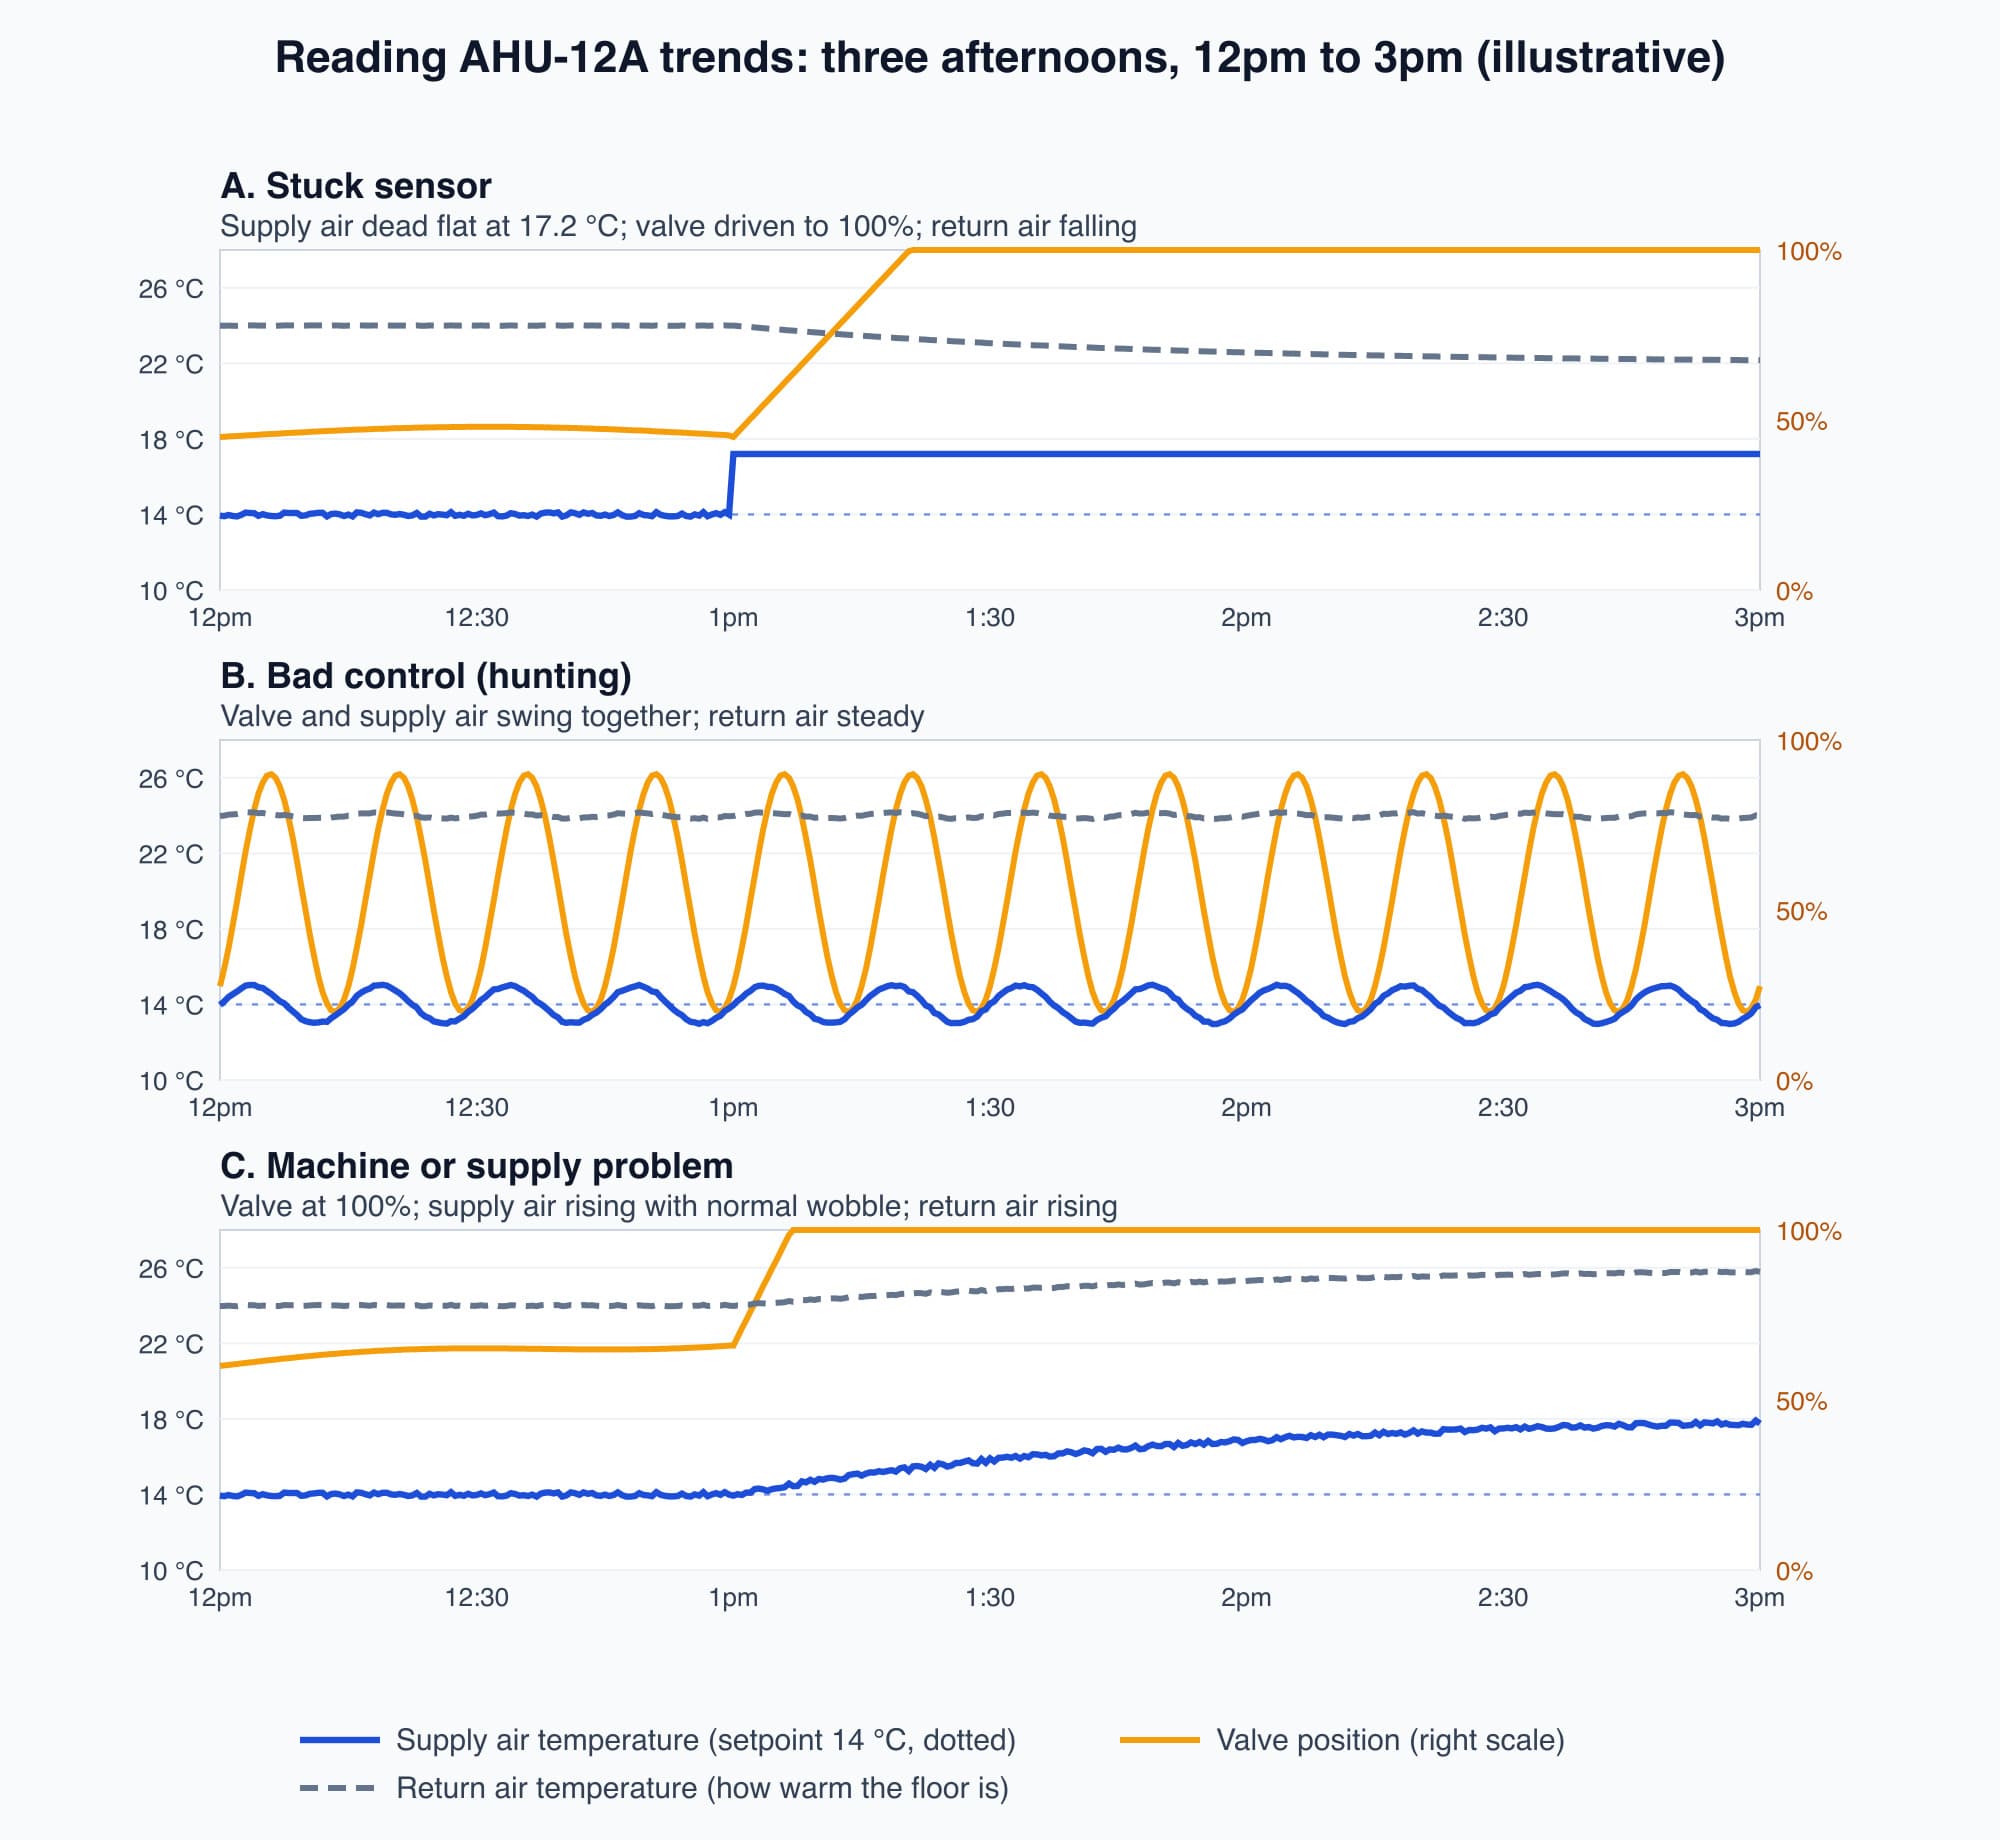
Three afternoons on AHU-12A (illustrative). Blue: supply air temperature. Amber: chilled water valve position. Grey: return air temperature.
Trace A: a stuck sensor. From about 1pm, the supply air reading sits at exactly 17.2 °C. It is perfectly flat, without the small wobble every real reading has. The controller sees an error of 14 − 17.2 = −3.2 °C (too warm), so the integral part keeps opening the valve until it reaches 100%. Meanwhile the return air temperature falls from 24 °C towards 22 °C, so the floor is getting colder, not warmer. The supply air cannot really be 17 °C if the floor is cooling down. The sensor is stuck (or its wiring has failed), and the controller is correctly acting on a wrong number. First check: measure the supply air with a handheld thermometer and compare it with the BMS reading.
Trace B: bad control (hunting). The valve swings between about 20% and 90% every fifteen minutes or so, and the supply air swings about a degree above and below 14 °C in step with it. The return air stays roughly steady at 24 °C, because the floor averages out the swings. This is the hunting pattern from Part 5, most often caused by tuning that is too aggressive. First check: make sure the valve moves smoothly (a sticking valve that jumps in steps can cause a similar wave), then retune the loop more gently.
Trace C: a machine or supply problem. From about 1pm, the valve is at 100% and stays there. The supply air reading moves normally, with its usual small wobble, but it climbs from 14 °C towards 18 °C over the next two hours, and the return air rises towards 26 °C. Every reading agrees: the floor really is getting warmer. The controller is doing all it can, so retuning will not help. The coil is not getting enough cooling. First check: look at the chilled water supply temperature from the plant for the same afternoon. If the plant was sending 6 °C water as designed, the problem is local to AHU-12A: a valve that is not really opening even though the BMS shows 100%, a blocked strainer, or a closed isolation valve. If the plant's supply water had risen well above 6 °C, the problem is in the chiller plant, and other AHUs will show the same pattern.
What the trend shows | Likely cause | First check |
|---|---|---|
Reading dead flat, controller at its limit, second measurement disagrees | Bad sensor or wiring | Compare with a handheld instrument |
Valve and temperature swing together in a regular wave | Bad control (tuning), or a sticking valve | Watch the valve move, then retune |
Valve at 100%, temperature rising, second measurement agrees | Machine or supply problem | Check chilled water supply temperature and flow |
Alarms tell someone that something is wrong now
If trends are the building's memory, alarms are its doorbell. An alarm is a rule that fires when a value goes out of range or a device reports a fault, and sends a warning to the operator straight away.
Common alarm rules include:
- Out of range: a zone that should be near 24 °C reads 29 °C.
- Failure to achieve setpoint: AHU-12A's supply air stays well above 14 °C for an hour with the valve fully open (Trace C would trigger this), or a chilled water loop never reaches its setpoint.
- Command and status disagree: the BMS commanded a fan or pump to start, but the status says it did not, as in Part 6. The motor may have tripped or the starter may have failed. A broken fan belt shows up here only if the status comes from a differential pressure switch or current switch, as Part 6 explained.
- Equipment fault: a variable speed drive reports its own fault code, or AHU-12A's filter differential pressure shows the filter is blocked.
An alarm turns an invisible problem into a phone call. Without alarms, a pump that fails at midnight is discovered at 8am when the lobby is warm and tenants are complaining. With a well-set alarm, the duty engineer gets a message at 12:01am and deals with it before anyone notices. An alarm buys time: the gap between something going wrong and someone feeling it.
Alarms also carry a priority. A fault that affects safety or comfort, such as a chiller trip or a smoke-related trip, should stand out. A filter nearing its change date only needs to appear on the next maintenance list. Priority lets an operator deal with the important things first.
Dashboards and graphics show the building live
The third view is the one most people picture when they think of a BMS: the graphics, sometimes called the dashboard. These are live, colour-coded pictures of the building. Floor plans show each zone shaded by temperature. Schematics draw the chillers, pumps, cooling towers, AHUs and valves as a diagram, with live values printed next to each piece of equipment.
A good schematic can be read at a glance. Running equipment shows one colour, stopped equipment another, and faults stand out in red or amber. The chilled water supply and return temperatures appear next to the pipes, and a valve drawn at 70% open looks 70% open. The operator scans the screen for the one thing that is the wrong colour, rather than reading every number.
Graphics are where the three views meet. From AHU-12A's graphic, the operator can click the supply air temperature to open its trend, and see any alarm attached to the unit. Live status, history and warnings are in one place.
Too many alarms means none get read
Alarm flooding happens when a BMS raises so many alarms, most of them unimportant, that operators stop reading them. It is a recognised cause of operators missing critical alarms, and it is one of the most common real-world failures in building automation.
Here is how it builds up. Every night, when AHU-12A stops on schedule, it raises a "low airflow" alarm, which is correct but pointless, because the fan is supposed to be off. A temperature sitting right at its alarm limit fires and clears every few minutes all night. A sensor with a limit set too tight raises an alarm on every normal swing. By morning, the alarm list has four hundred entries. Somewhere among them is one real alarm: a chilled water pump that has actually failed. It looks exactly like the other three hundred and ninety-nine, so nobody sees it.
This is not laziness. Once people learn that the alarm list is mostly noise, they stop looking, and the alarm system then catches nothing. A well-run system does the opposite:
- Remove nuisance alarms. Suppress alarms on equipment that is off on purpose. Add short delays and deadbands (the on/off gaps from Part 4) so values near a limit do not keep firing and clearing.
- Set priorities. A small number of critical alarms should stand out from routine ones. If everything is urgent, nothing is.
- Make trends useful. Log the points that answer real questions, at intervals that show what happened, kept long enough to compare weeks.
- Review them. Someone should own a weekly look at trends and alarm counts. Without that, the data never turns into decisions.
Setting up useful alarms and clear graphics is part of commissioning, not a task to rush on handover day. It is a large part of making a BMS, or an upgraded mixed-vendor one, usable by the people who run the building, and it is part of the building automation work on any project.
Forgotten manual overrides switch the automation off without warning
Every BMS lets an operator take a point out of automatic control and set it by hand. At the equipment, this is the hand-off-auto (HOA) switch: Hand runs the equipment regardless of the BMS, Off stops it, and Auto gives control back to the BMS. In software, an operator can put a point into override, fixing it at a chosen value so the sequence no longer controls it.
Overrides exist for good reasons. During a fault, a commissioning test or an emergency, an operator may need to force a valve open or keep a fan running. The problem is the override that is never removed.
The pattern is common. One hot afternoon, level 12 east is too warm, so the operator overrides AHU-12A's chilled water valve to 100% open. The complaint stops, and the override stays. From then on, the valve is always fully open. The PI loop from Part 5 no longer controls it, and the supply air is colder than it needs to be whenever the fan runs, which wastes cooling every day. Nothing on the screen looks wrong: the building still runs, it just uses more energy than it should. Add up every "temporary" fix left in place over a few years, and a plant can run close to full output while the BMS appears normal.
Forgotten overrides and disabled sequences are one of the most common reasons BMS savings fade over time. The automation is still installed, but it is not being allowed to run.
The defence is visibility. A well-built graphic marks every overridden point with a distinct colour or a hand symbol, so an operator can see at once that, for example, six points are in manual and ask whether they still should be. A regular "points in hand" review, going through the graphics and the HOA switches looking for anything not in Auto, is one of the most valuable habits a facility team can build. It takes about an hour and can recover much of the saving the automation was bought for.
(A BMS is built to show what is happening now and over recent weeks. Its trend storage is usually local and kept for weeks or months, not years, so comparing this year's chiller efficiency with the last three years, or benchmarking one building against others, is not what it is designed for. Part 16 looks at where control ends and long-term analysis begins.)
Worth knowing: The "valve position" in many BMSs is the command the controller sends, not a measurement of where the valve really is. If the valve's actuator has failed, the BMS can show 100% while the valve stays shut. When the trend points at the valve, someone has to go and look at it.
What comes next: how the equipment talks to the BMS
Every trend, alarm and graphic in this part depends on the BMS receiving readings from equipment, and the office tower, like most buildings, has equipment from several makers. The next part, BACnet vs Modbus: The Two Languages Building Equipment Speaks, explains the two most common ways that equipment and the BMS exchange data. It opens with this question: how does a reading from another maker's equipment, such as a chiller, reach the BMS in a form it understands?
Check your understanding
- AHU-12A's supply air reading has been exactly 17.2 °C since 1pm, with no wobble. The valve is at 100%, and the return air has fallen from 24 °C to 22 °C. Is this a sensor, control or machine problem, and what would you check first? It is most likely a sensor problem. A real reading always wobbles a little, and the floor is getting colder, which cannot happen if the supply air is really 17 °C. The controller is opening the valve fully because of a wrong reading. Check the supply air with a handheld thermometer and compare it with the BMS value.
- Three months ago an operator overrode AHU-12A's chilled water valve to 100% to fix a complaint and never released it. What is happening now, and how would a team find it? The valve is fully open whenever the fan runs, so the supply air loop no longer controls it and the unit wastes cooling every day, while the screen looks normal. A graphic that marks overridden points, and a regular points-in-hand review of overrides and HOA switches, would show it so someone can return the valve to Auto.
Recap: A BMS gives the operator three views. Trends are the building's memory and answer what happened; alarms are its doorbell and say what is wrong now; graphics show what is happening live, with links to trends and alarms. To read a trend, plot the measurement, the controller's output and an independent measurement together: a dead-flat reading that disagrees with the floor points to the sensor, a regular swing points to tuning, and a valve at 100% with a rising temperature points to the machine or the chilled water supply. Alarms only work if nuisance alarms are removed and priorities are set, and savings only last if forgotten overrides are found and released.
Go deeper on video (optional)
This video is about designing operator screens that make the one important condition stand out, which is the idea behind the sections on dashboards and too many alarms. It is optional.
RealPars breaks down high-performance HMI design — why a good operator screen should surface the one condition that matters instead of drowning the operator in numbers, colour and alarms.
This is Part 8 of 16 in Cobler's Building Automation and BMS Fundamentals course. Previous: BMS Scheduling and Optimum Start: How a Building Wakes Itself Up. Next: BACnet vs Modbus: The Two Languages Building Equipment Speaks.
Cobler builds CobiNeural, a platform that shows a facility team its building's energy, water and indoor air data as live numbers across the whole site. To see how your building performs, talk to us.
FAQ
Frequently asked questions
Ask us about this topic
Something in this article you want to dig into — or a situation in your own building it doesn't quite cover? Send us your question. We don't run public comments; the team replies to you directly by email.