Blog
The Limits of a BMS: Where Control Ends and Analytics Begins
A BMS runs your building brilliantly right now, but rarely tells you if it has run well all year. Here's the honest line between control and analytics.
 Tan Kok XinBuilding Automation & BMS Fundamentals
Part 16 of 16 in Cobler's Building Automation and BMS Fundamentals course. New here? See the course page.
Part 15 proved on test day that the building management system (BMS) runs AHU-12A as its sequence says. That left a question: why can a BMS that passed every test still drift into wasting energy, and what would show that drift? Walk into the office tower on a hot afternoon a year later and everything may seem fine: the lobby is cool, the air is fresh and no alarms are sounding. That does not prove it is running well. A BMS is built to control the building now: to decide what each piece of equipment should do at this moment. It is not built to keep years of data, compare energy, water and air quality side by side, spot slow drift or check its own sensors. That second job is measurement and analytics, and it needs its own layer. This last part explains where control ends and analytics begins, and then recaps the course.
A BMS is built to control the building in the present
Everything in Parts 1 to 15 comes back to one question the BMS asks over and over: given what is happening right now, what should each piece of equipment do? A well set-up BMS:
- Decides and acts in real time. It reads a temperature, compares it with a setpoint and moves a valve or damper to close the gap. That closed feedback loop (Part 4) is the core of control.
- Holds setpoints. It keeps the chilled water supply at, say, 6 °C and a floor at 24 °C, and it keeps them there as the sun moves and people come and go.
- Sequences plant. It stages chillers, pumps and cooling towers on and off in the right order (Part 12), so the building gets the cooling it needs without running more machines than necessary.
- Raises alarms. When a value leaves its safe range, it tells someone quickly enough to prevent damage or a comfort complaint (Part 8).
This is hard to do well. Designing, integrating and commissioning the control layer is skilled work, and it is the subject of building Automation Services.
The same focus makes a BMS weak at looking back
Because a BMS is designed around the present, it is weak at four jobs that look back over time.
1. Keeping long-term data. Many BMS platforms keep detailed history for a limited period, then thin it out or overwrite it. When you want to compare this June with last June, the detailed data may already be gone. (Part 8 described the limits of BMS trend storage.)
2. Comparing across domains. A BMS tends to see its own points one at a time: this valve, that fan, this zone temperature. It rarely brings energy, water and indoor air quality together into one view that says how many kWh and litres the building used this month to keep people comfortable. Comparing the building with its own past, or with a sensible target, is not what it was built for.
3. Spotting slow drift. Imagine a chiller plant that started at 0.6 kW per refrigeration ton (kW/RT, the plant efficiency measure from Part 12), a healthy figure. Over a year, fouled heat exchangers, a drifting sensor and a valve that no longer closes fully push the plant to 0.9 kW/RT. The plant now uses roughly 50% more electricity for the same cooling. But on any one day the change is a tiny fraction of a percent, far too small to trigger an alarm, and nobody in the cool lobby notices. A control system watching present values will not flag it. Only a record of the kW/RT over months shows the slope.
4. Checking itself. A BMS reports on itself. If a sensor drifts, the BMS believes the drifted reading, controls to it and reports that all is well. Part 15's test B showed what happens when a BMS trusts a bad reading. To trust a number over the long term, it helps to have a measurement that is not also the thing doing the controlling.
None of this is a fault in good automation. These are different jobs, and a controller is the wrong tool for them.
A separate layer measures instead of controls
The job of looking back has its own layer. Alongside the real-time control, a monitoring and analytics layer measures and trends the building's performance over time, independently of whatever is doing the controlling.
This layer also includes fault detection and diagnostics (FDD): software that watches performance data and flags patterns that look like faults, from outside the control loop rather than inside it. FDD tools vary widely in how much they can diagnose automatically. What they have in common is that this layer observes and does not act. It never moves a valve. It records, compares and shows what the numbers say.
So there are two layers with two jobs:
- A BMS decides and acts. That is control, or automation.
- A monitoring layer measures, compares and shows drift. That is analytics.
They work together rather than compete. The BMS keeps the building running now. The monitoring layer tells you whether it has been running well, and gives you the evidence to act.
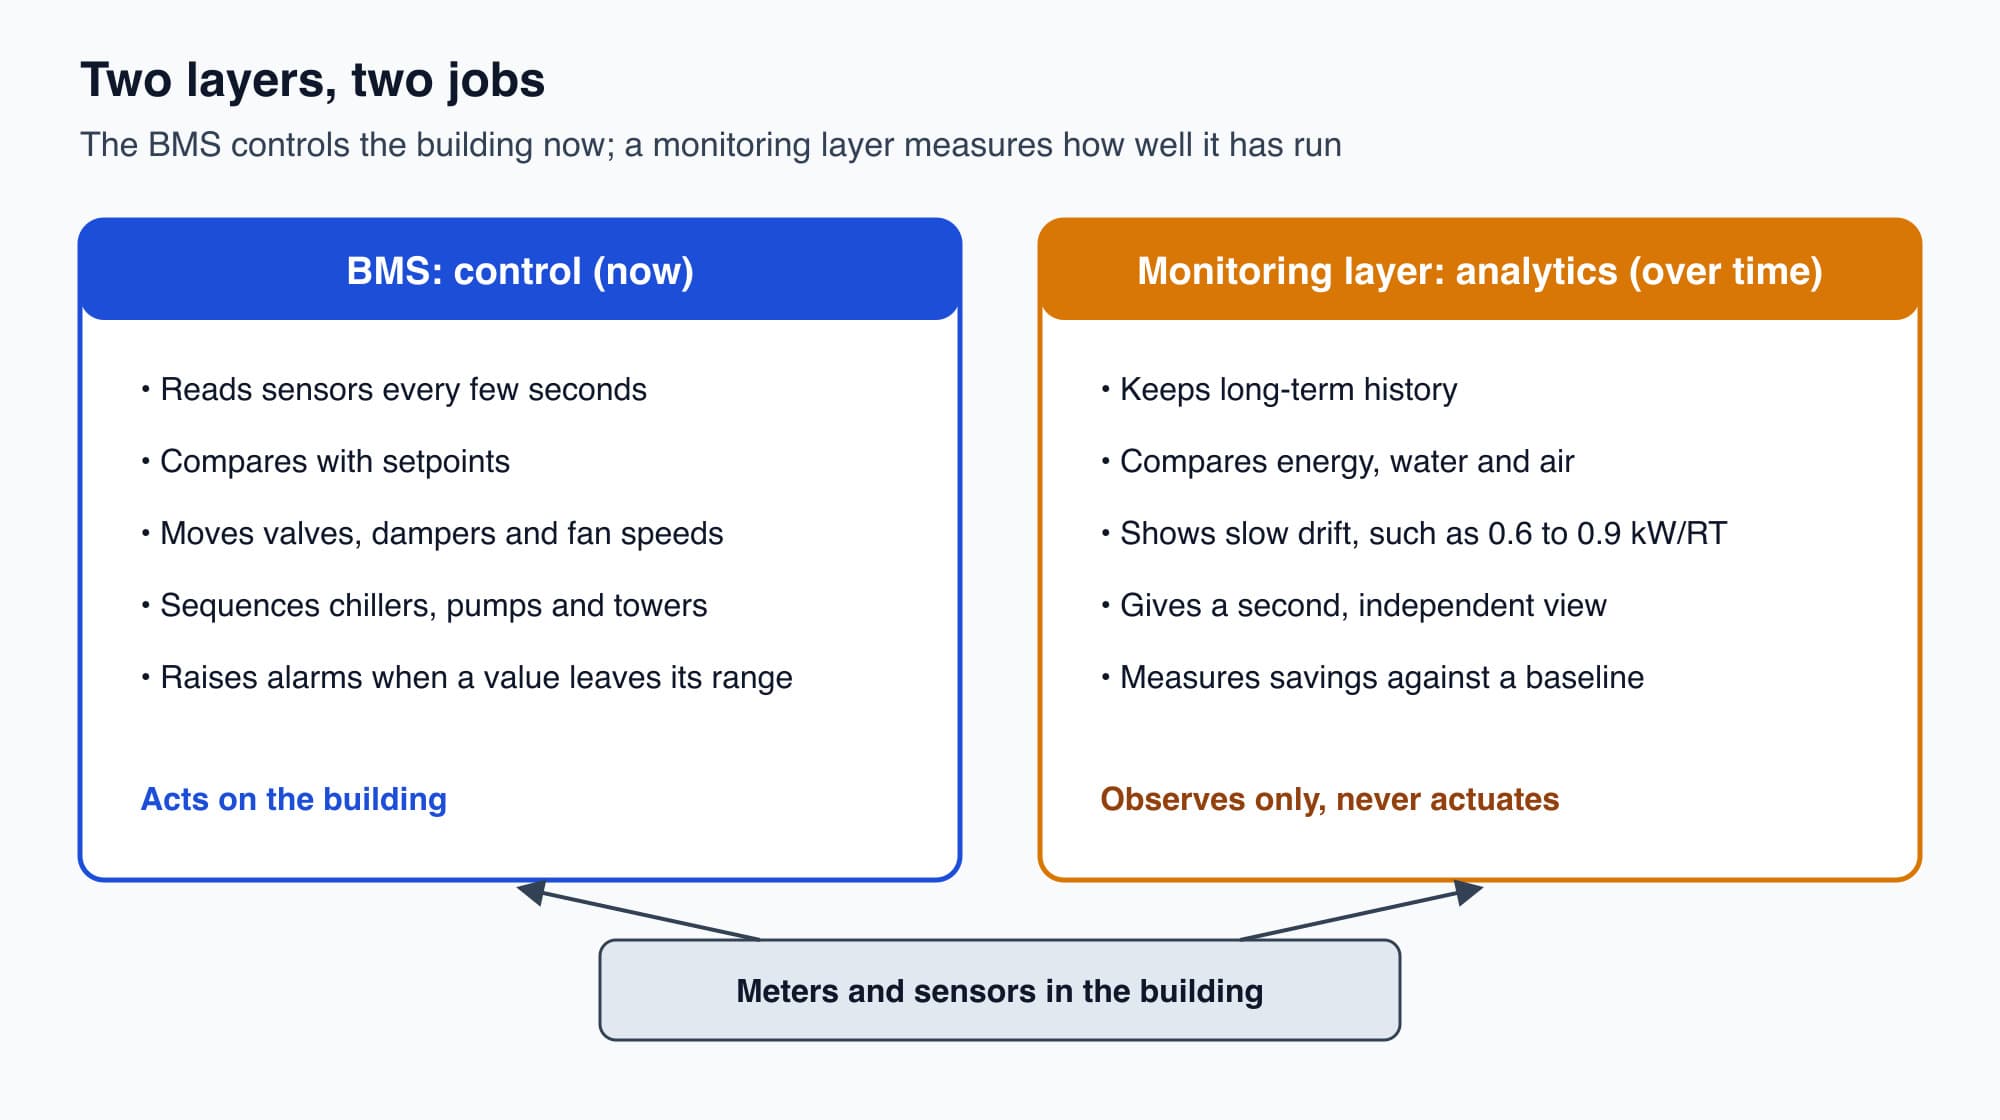
The BMS acts on the building now; the monitoring layer observes and compares over time. Both can read the same meters and sensors.
Measure first, then verify the saving
The most practical habit this layer makes possible is measurement and verification (M&V): proving a saving with measured data instead of assuming it.
- Before changing anything, record a baseline: how much energy the building used, in kWh, under known conditions.
- Make the change, for example a chilled water temperature reset, a corrected sequence or a cleaned heat exchanger.
- Measure again and compare like with like. A fair comparison allows for differences in weather and occupancy between the two periods.
"We reset the setpoint and it should save around 8%" is an estimate. "We reset the setpoint and metered consumption fell by 40,300 kWh over the following quarter" is a measured result that a finance team can check. The Economics course covers how to build a baseline and an M&V plan properly.
The same metering also records demand, which matters if the building is on a tariff with a maximum demand charge. Part 14 explained which tariffs charge for demand and when. The Electricity course's Power vs Energy: kW and kWh explains the two units, and our maximum-demand calculator lets you try your own numbers.
You do not need a full BMS to start measuring
Because a monitoring layer only observes, it can be added to a building with or without a modern BMS.
Replacing a building's controls is a real project: new controllers, wiring and field devices, and then commissioning as in Part 15. Many buildings, especially older ones, have no modern BMS, or a mix of ageing systems from different suppliers (Part 10). Asking those owners to replace their controls before they can understand their energy use is expensive and gets the order wrong.
A measurement layer reads meters and sensors, keeps its own long-term history and starts trending performance straight away, even where the control system is old or minimal. The building gets visibility first. That visibility then shows where an automation upgrade would pay off, so the money goes to waste that has been measured rather than guessed.
Cobler's CobiNeural is a monitoring layer of this kind, not a BMS: it does not decide, sequence or actuate anything. It measures and trends four domains, energy, indoor air quality, water consumption and chilled-water systems, where it turns flow and supply and return temperatures into delivered cooling kW and kW/RT, and it sits alongside the BMS. Where the control layer itself needs building or modernising, that is the Automation side.
Worth knowing: The office tower is already in this position. Its plant was designed for 0.85 kW/RT and measures 0.95 kW/RT, about 90 kW more at the 900 RT peak (Part 12), yet no alarm has ever said so. Only a measured record of kW/RT shows the gap.
Optional detail: kW/RT can also be written as a coefficient of performance (COP, cooling output divided by electrical input). One refrigeration ton is 3.517 kW of cooling, so 0.6 kW/RT is a COP of about 3.517 ÷ 0.6 ≈ 5.9, and 0.9 kW/RT is a COP of about 3.9.
The whole course in one page
Here is the path we have taken, with AHU-12A of the office tower as the thread.
- How a BMS thinks (Parts 1 to 5). A BMS senses, decides and acts. Sensors measure, actuators move valves and dampers, and controllers connect them through input and output points. A control loop compares a measurement with a setpoint and corrects the difference, and PID tuning decides how firmly it corrects.
- Running a building (Parts 6 to 8). A written sequence of operation says what the controls must do, including when things fail. Schedules, setback and optimum start match the building to its hours. Trends, alarms and dashboards let an operator see what happened, and overrides must be found and released.
- Connecting and owning it (Parts 9 to 11). BACnet and Modbus carry the data. Integration means mapping each point's units, scaling and timestamps correctly. Someone must own the network, the logins and the backups, and know how to recover.
- Applying it (Parts 12 to 14). The BMS stages chillers and resets temperatures, controls VAV boxes, fan coil units and fan speed on the air side, and limits the building's half-hour demand where the tariff charges for it.
- Finishing (Parts 15 and 16). Commissioning proves the BMS does what its sequence says. A separate monitoring layer then shows, over months and years, whether it keeps doing so.
What comes next
This is the end of the Building Automation and BMS Fundamentals course. If you want to go further, the Cooling Fundamentals course explains the physics of the plant your BMS spends all day controlling, and the Learn hub lists all of Cobler's courses, including Electricity Fundamentals.
Check your understanding
- A chiller plant's efficiency moves from 0.6 to 0.9 kW/RT over a year, and no BMS alarm ever fires. Why not, and what would show the change? The change on any single day is far too small to cross an alarm limit, and the building stays comfortable, so nobody complains. A BMS watches present values, not the slope over months. A monitoring layer that records kW/RT over time shows the drift as a steady rise.
- Why is a baseline needed before claiming a saving? Without a record of energy use before the change, there is nothing to compare the new readings with, so any "saving" is an estimate. With a baseline, measured under known conditions and adjusted fairly for weather and occupancy, the saving becomes a measured result.
Recap: A BMS is a real-time controller: it decides, acts, holds setpoints, sequences plant and raises alarms. It is weak at long-term storage, comparing across energy, water and air, spotting slow drift and checking its own sensors. A separate monitoring and analytics layer observes without acting, and it can be added with or without a modern BMS. Measure a baseline, make the change, and verify the saving with data. Control keeps the building running now; measurement shows whether it has kept running well.
This is Part 16 of 16 in Cobler's Building Automation and BMS Fundamentals course. Previous: Proving the BMS Works: Commissioning and Handover.
Cobler builds CobiNeural, a platform that shows a facility team its building's energy, water and indoor air data as live numbers across the whole site. To see how your building performs, talk to us.
FAQ
Frequently asked questions
Ask us about this topic
Something in this article you want to dig into — or a situation in your own building it doesn't quite cover? Send us your question. We don't run public comments; the team replies to you directly by email.