Blog
Campus Energy Management for Malaysian Universities
Malaysian campuses cross the EECA threshold long before anyone treats energy as a portfolio problem. A practical guide to baseload audits, faculty sub-metering and demand ownership across dozens of buildings.
 Tan Kok XinIndustry Guides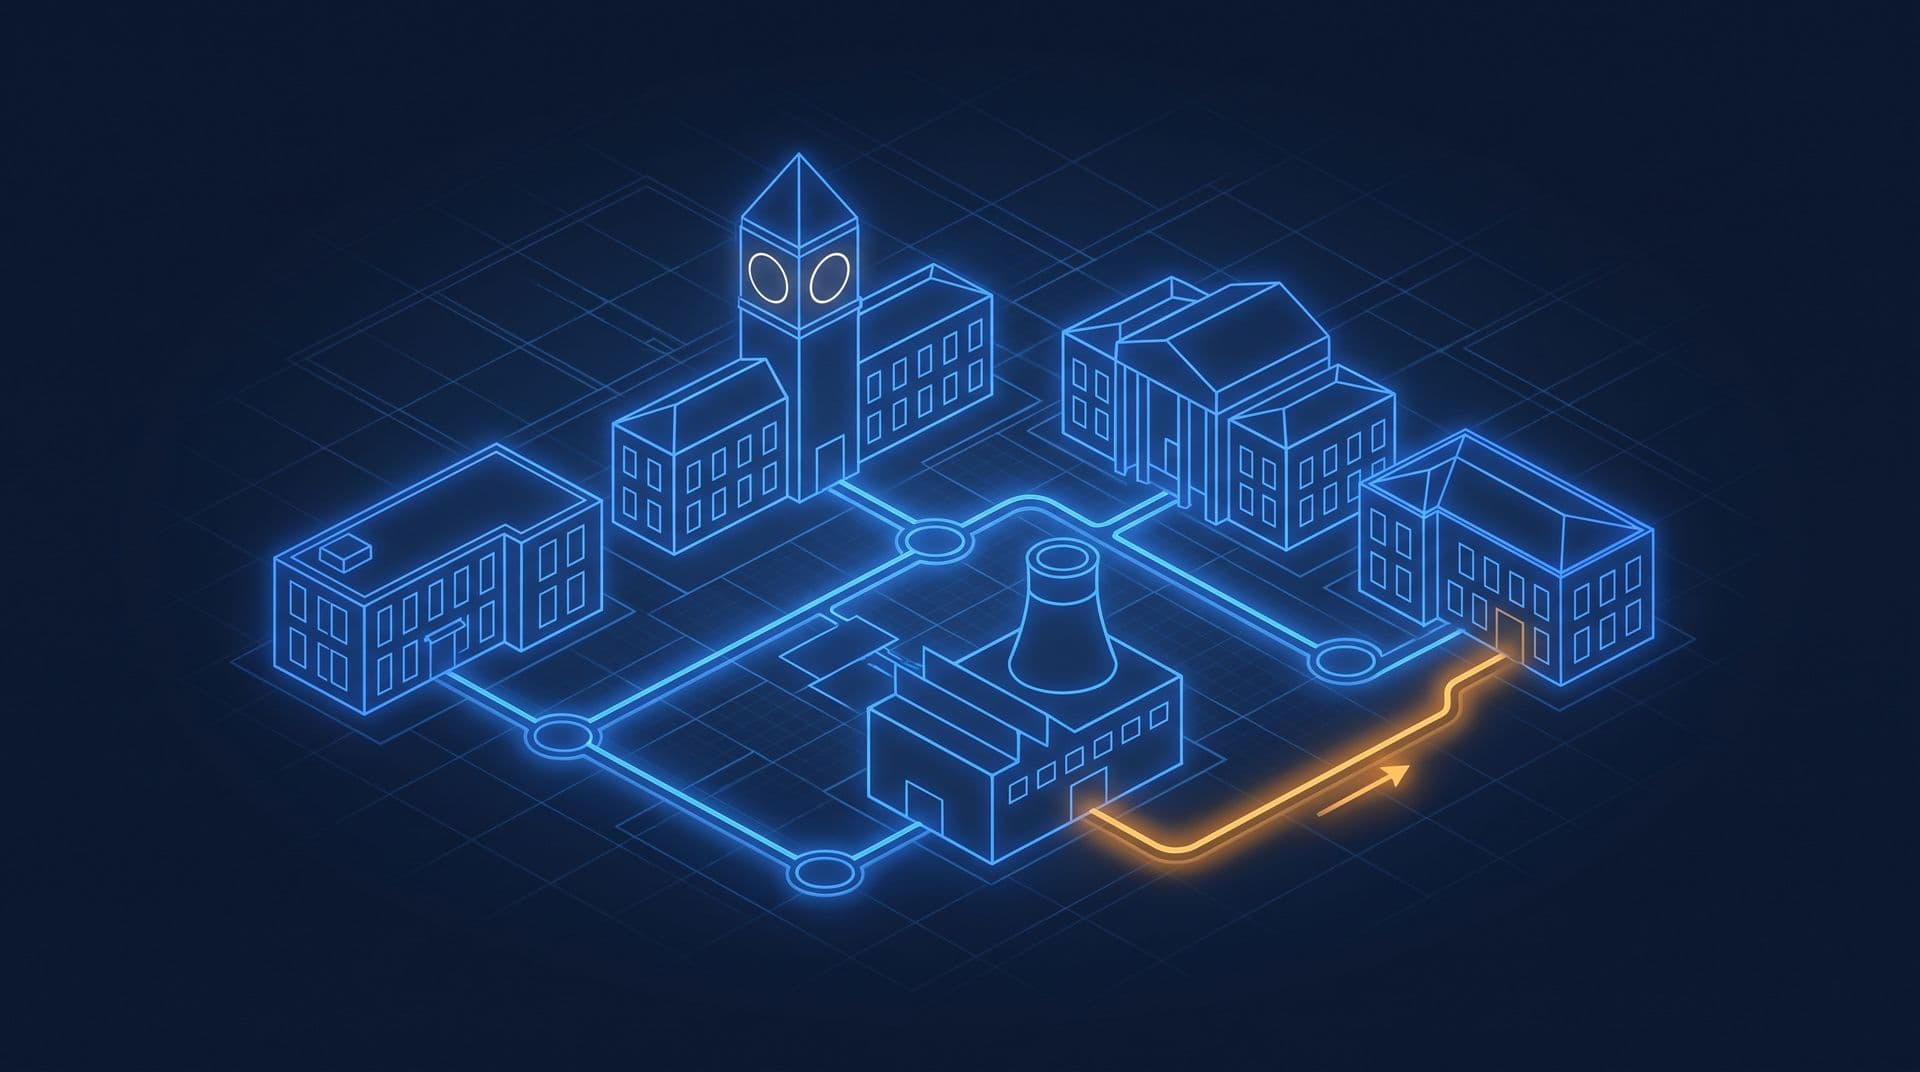
Under the Energy Efficiency and Conservation Act 2024, an organisation becomes a regulated energy consumer at 21,600 gigajoules over twelve consecutive months. That is 6 GWh of electricity a year. A campus running at around 136 kWh/m² per year, the MS 1525 reference figure for non-residential buildings, reaches 6 GWh at roughly 44,000 m² of gross floor area: one faculty tower, a library, a sports complex and two hostel blocks. Most Malaysian universities passed that line years ago. Campus energy management is now a compliance function as well as a cost one, and it usually fails for reasons that have nothing to do with equipment.
In short
- A university campus is dozens of buildings sharing one maximum demand, so a single building's peak can set the whole campus's bill.
- Consumption often does not fall much during semester break because labs, servers and base building systems keep running regardless of teaching schedule.
- A campus consuming around 6 GWh a year or more likely crosses the 21,600 GJ EECA 2024 designation threshold.
- Faculty-level sub-metering is mainly a governance fix, giving each faculty visibility and accountability for its own consumption, not just a metering upgrade.
A campus is dozens of buildings sharing one maximum demand
The single-building playbook breaks on a campus because the failure modes are structural, not technical.
You have mixed vintages sitting on the same ring: an older lecture block with constant-volume AHUs, a hostel on hundreds of standalone split units, a recent research building with VAV and a proper BMS. Only one of those three is visible to your control system. The splits are invisible by design, and on most Malaysian campuses they represent a large share of the connected cooling load.
You also have your own distribution. Universities that take supply at 11 kV or 33 kV get metered by TNB at one or two intake points and own everything downstream: the internal ring, the distribution substations, the transformers under each faculty. That is a licence to be blind. TNB tells you what the campus used. Nothing tells you which building used it, unless the university installed that metering itself, and most did not beyond a few legacy check meters that nobody has read since commissioning.
The sharpest consequence is maximum demand. The whole campus records one MD figure, and at RM 89.27/kW Capacity Charge plus RM 97.06/kW Network Charge, that is RM 186.33 per kW per month, about RM 2,236 per kW per year. A commissioning test on a new chiller in the afternoon, or every AHU on campus restarting together on the first day back after Raya, sets a number that the whole institution pays for. No faculty owns it, so no faculty manages it. Ownership of coincident demand is the first thing a bursar should assign to a named person.
And nobody pays a bill. In a commercial tower the tenant sees a number every month. A dean sees nothing. Buildings arrive by grant or donation with a naming plaque and no operating budget attached, and the electricity lands on a central utilities line item that grows without explanation.
Why doesn't campus consumption fall during semester break?
Because the schedules are not schedules, and nothing in the organisation notices.
Plot a full year of interval data and look at two things. First, the overnight floor: the lowest 30-minute demand between midnight and 5am. Second, the mid-break weekday profile against a mid-semester weekday profile. On a well-run campus the break-week curve is visibly flatter and lower. On most campuses the two curves lie almost on top of each other, which means the AHUs still start at the same hour every morning, the chillers still stage up to hold a setpoint for empty lecture theatres, and the corridor lighting was never on a schedule at all. Air conditioning is where the swing lives: in hot-climate university teaching buildings it can exceed 40% of total consumption.
Size the prize before you spend anything. Take a 6 GWh campus averaging 685 kW across the year. Suppose the overnight and weekend floor sits at 300 kW, and half of that is cooling and lighting serving unoccupied space. Roughly 6,000 hours a year fall outside weekday working hours, so 150 kW of avoidable load over those hours is about 900 MWh, or 15% of annual consumption. Every one of those numbers is illustrative, but you can replace them with your own in an afternoon.
Before you judge the floor, subtract what legitimately runs: ultra-low-temperature freezer farms, animal houses, cold rooms, fume hoods on 24-hour exhaust, server rooms, security lighting. Those loads are real and often growing. The point of the baseload audit is to separate them from the loads that are simply never switched off.
Does EECA 2024 apply to a university campus?
If your total consumption clears the threshold, yes, and the way the threshold is measured catches campuses that assume they are exempt.
The obligation attaches to the legal person, not the building. A university aggregates every meter under its registration, across branch campuses under the same entity. On-site solar generation counts too: the guidelines measure energy generated from solar PV at your own measuring points, so a large rooftop array does not reduce you below the line. The mechanics of registration, the energy management system and the audit cycle are covered in our EECA compliance guide.
Two details matter specifically for a bursar. The Registered Energy Manager must be appointed from among employees, which is a headcount and a job description, not a consultancy engagement. And the building label track is a separate obligation aimed at office buildings above 8,000 m² gross floor area, so a lecture block is not automatically caught by it. Confirm your own status against the Energy Commission's EECA materials rather than assuming either way.
Faculty-level sub-metering is a governance fix, not a metering project
Departments respond to numbers with their names on them. That is the whole mechanism, and the meter is only the instrument that produces the name.
Meter to the boundary a dean actually controls, which is often a building or a floor group, not a switchboard. If your metering plan follows the electrical topology instead of the org chart, you will produce data nobody is accountable for. The technical side of finding problems this way is covered in our guide to sub-metering; the campus-specific part is who receives the number.
Meter chilled water energy, not just electricity, for buildings on the central plant. If you only meter electricity, the faculty on district cooling looks almost free while the faculty on splits looks like a problem, and you will optimise exactly backwards. BTU meters on the building risers fix this and give you the allocation basis for internal chargeback.
Then rank, do not just report. Publish a building energy index per building within peer groups, so an older teaching block is compared against other teaching blocks rather than against the new research building. A shadow bill works even when no money moves between cost centres. Universities already run cost-centre accounting; the reporting machinery exists and only needs an energy line.
Quick wins that fit one budget cycle
Ranked by return per ringgit spent, for a bursar deciding what to fund this year:
- Assign ownership of maximum demand. Zero capex. Stagger post-break restarts across two hours, move commissioning and load tests off the afternoon peak, and check that no two chillers are ever brought on together. Shaving 100 kW of coincident peak is worth roughly RM 224,000 a year at current RP4 demand rates.
- Write one break schedule and give it an owner. Every semester break, one override profile per building, reviewed the Monday after it starts. Most campuses discover the schedule was never applied.
- Feed the room-booking system into the BMS. Your timetable already knows which lecture theatres are used on Friday afternoon. That is an occupancy signal you are paying to collect and then ignoring.
- Check power factor at each intake. Old motor loads and long internal cable runs drift. The surcharge threshold is 0.85 below 132 kV, and capacitor bank repairs are cheap relative to what they recover.
- Tune the chiller plant before replacing it. Staging and reset logic on the plant you already own is far cheaper to fix than the plant is to replace, and it is usually where the first year of savings comes from.
Where continuous monitoring fits in campus energy management
The value on a campus is the portfolio view, not another building dashboard.
Forty separate dashboards is forty things nobody opens. One ranked list of forty buildings, sorted by deviation from their own recent pattern, is a short morning routine for one facilities engineer. Nobody walks every building on a campus every week, which is precisely why anomalies survive for months here and get caught in days in a single tower.
Set alerts on ratios rather than levels. Overnight demand as a percentage of that building's own daytime peak, tracked week over week, catches the loads that break your empty-campus assumptions: the freezer farm a research group added without telling facilities, the fume hood left at full sash over the long break, the departmental server rack that IT installed in a basement store room. In absolute terms each looks small. As a step change in one building's overnight ratio, each is obvious.
None of this requires ripping out what you have. On a campus the practical shape is an overlay: keep the existing BMS running the central plant, pull its data up alongside new metering on the buildings that have no controls at all, and report against one energy model for the whole estate.
For the full mechanics of a TNB bill, see our free course Understanding Your Electricity Bill.
If you are mapping out sub-metering or preparing for your first EECA reporting cycle, request a demo and we can walk through what a campus-scale rollout looks like against your existing meter and BMS inventory.
FAQ
Frequently asked questions
Ask us about this topic
Something in this article you want to dig into — or a situation in your own building it doesn't quite cover? Send us your question. We don't run public comments; the team replies to you directly by email.