Manufacturing · Case Study
Kah Hwa Industries: Energy Monitoring for Textile Manufacturing
Kah Hwa Industries, a textile manufacturer, replaced a single monthly bill with real-time, equipment- and process-level energy data from CobiNeural across spinning, weaving, dyeing and finishing.
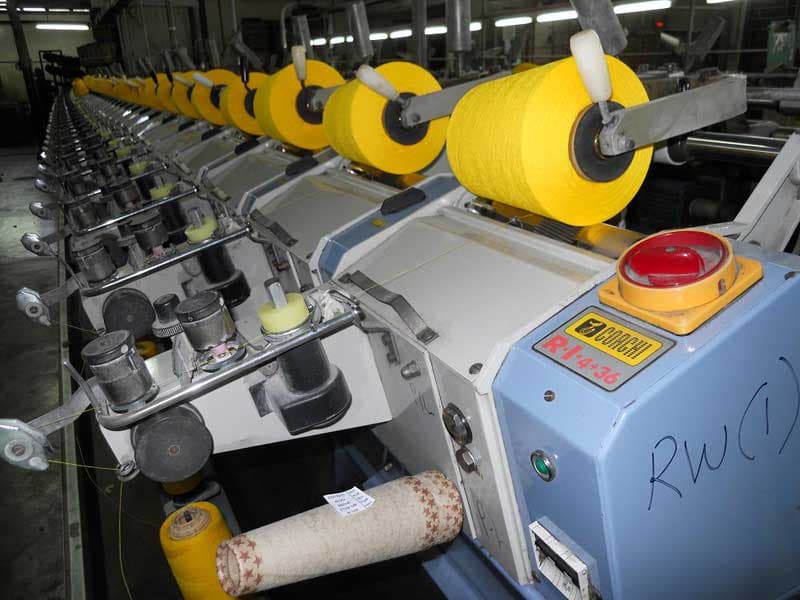
Kah Hwa Industries uses CobiNeural to see its energy use in real time, by equipment and by process, across spinning, weaving, dyeing and finishing. Before, the plant had only a monthly bill. Now the team has a measured basis for finding waste, comparing lines and checking whether an efficiency measure worked.
The site
Kah Hwa Industries is a textile manufacturer. Spinning, weaving, dyeing and finishing each use a lot of power for motors, boilers, compressed air and process heat, often across several shifts. The loads are very different. Spinning and weaving use high-torque motors. Wet processing needs steam and hot water. Pumps, fans and compressed air keep the lines moving. Each load changes from hour to hour, and each hides its own waste inside the plant's total meter reading.
When the only number is a monthly Tenaga Nasional Berhad (TNB) bill, the plant cannot tell which process, line or shift is driving cost. Waste shows up four weeks later as a charge that has already been incurred.
The problem
Kah Hwa Industries wanted clear, continuous visibility of energy use across production, not one monthly figure that says nothing about individual processes or shifts.
A single bill answers how much the plant used. It does not answer the operating questions:
- Which dyeing batch ran inefficiently?
- Is the baseline between shifts higher than it should be because equipment is left idling?
- Are the compressors and chillers losing efficiency?
- Is the plant heading towards a new maximum demand peak, which would set the demand charge for the whole month?
Without measurement at equipment and process level, these answers are guesses, and guessing is an expensive way to run a power-intensive plant.
The same gap sits under any serious efficiency or compliance programme. A plant cannot benchmark a line, justify a retrofit, or build a baseline aligned with the Energy Efficiency and Conservation Act (EECA) or the ISO 50001 energy management standard from one monthly number with no breakdown.
What we did
CobiNeural monitors energy across the production process in real time. It organises the site the way operators think about it: locations and zones first, then the equipment inside them (chillers, compressors, motors and pumps), then the sensors that supply the data.
Four modules do the work at Kah Hwa Industries:
- Insights to Energy is the core. It tracks consumption, demand, the Max Demand KPI (key performance indicator), power factor and energy use intensity by location and by equipment. The team can compare spinning with wet processing, the night shift with the day shift, and see where the kilowatt-hours (kWh) go.
- Insights to Equipment provides data for individual machines, including motor efficiency from power meters and drive data, through equipment-level sub-metering. A compressor whose consumption is drifting, or a line using more than it should, shows up as a trend rather than a surprise on the bill.
- Alerts notifies the team when consumption or demand moves outside expected limits, so they can respond while the problem is still happening.
- Reporting prepares the same data for EECA and internal review. The measurements used for daily decisions are the same ones used for compliance.
CobiNeural runs on its own or as an overlay on an existing building management system (BMS), programmable logic controllers (PLC) or SCADA (supervisory control and data acquisition) system. The plant did not have to replace its controls to gain this visibility. With the baseline in place, the same data can support automation projects for the loads that justify them.
What changed
Kah Hwa Industries now has a measured picture of energy use across textile production. This is the basis for finding waste, benchmarking lines and reducing cost per unit.
With process- and equipment-level data, the team can find where the waste is, see which line is the outlier, notice when a maximum demand peak is forming, and check whether an efficiency measure worked. The measurement comes first, and the decisions follow from it.
If your plant still runs on one number a month, start where Kah Hwa Industries did: see where the energy goes. Explore more case studies, or book a demo to see CobiNeural on your own production floor.
Ready to achieve similar results?
Let's discuss how CobiNeural can transform your energy management.