Blog
Making the Case: A Full Energy Project Appraisal, Start to Finish
A full energy efficiency business case for one office tower measure set: savings at the marginal rate, life-cycle cost, NPV, payback, IRR, sensitivity, cost per tonne and the M&V plan, on one page.
 Tan Kok XinEnergy Management: The Economics of Saving Energy
Part 10 of 10 in Cobler's Energy Management: The Economics of Saving Energy course. New here? See the course page.
Part 9 showed how far the office tower's NPV can move and which assumption matters most, so the case is ready to put in front of management. If you have ever asked your family, or a bank, to agree to a large purchase, you know what they ask: what does it cost, what does it save, how sure are you, and how will we know it worked? A business case for an energy project answers the same four questions for a finance director.
This last part runs one project through every tool in the course, from start to finish, and ends with a one-page energy efficiency business case. The project is the office tower measure set you have followed since Part 2. Each step below reuses a number you have already worked out, so you can see how the parts fit together.
The project on the table
Our example office tower is a fictional 20-storey office building in Kuala Lumpur, supplied at 11 kV on the MV non-domestic General tariff. It uses about 6,000,000 kWh a year, and its maximum demand (MD) is about 1,600 kW. The facility team proposes three measures:
- M1, chiller plant scheduling. Stop the chiller plant at 6pm with the air handling units, instead of running it on an old schedule until 8pm, with an after-hours request button for late tenants. RM15,000.
- M2, variable speed drives (VSDs) on the two condenser water pumps. Let the pumps slow down when full flow is not needed. RM80,000.
- M3, BMS demand limiting. The building management system (BMS) holds off car park fans, water transfer pumps and a small chilled-water temperature reset in the highest half-hours, so the monthly peak falls. RM35,000.
Total capital cost (capex): RM130,000, installed from October to December 2026. The first full year of savings is 2027.
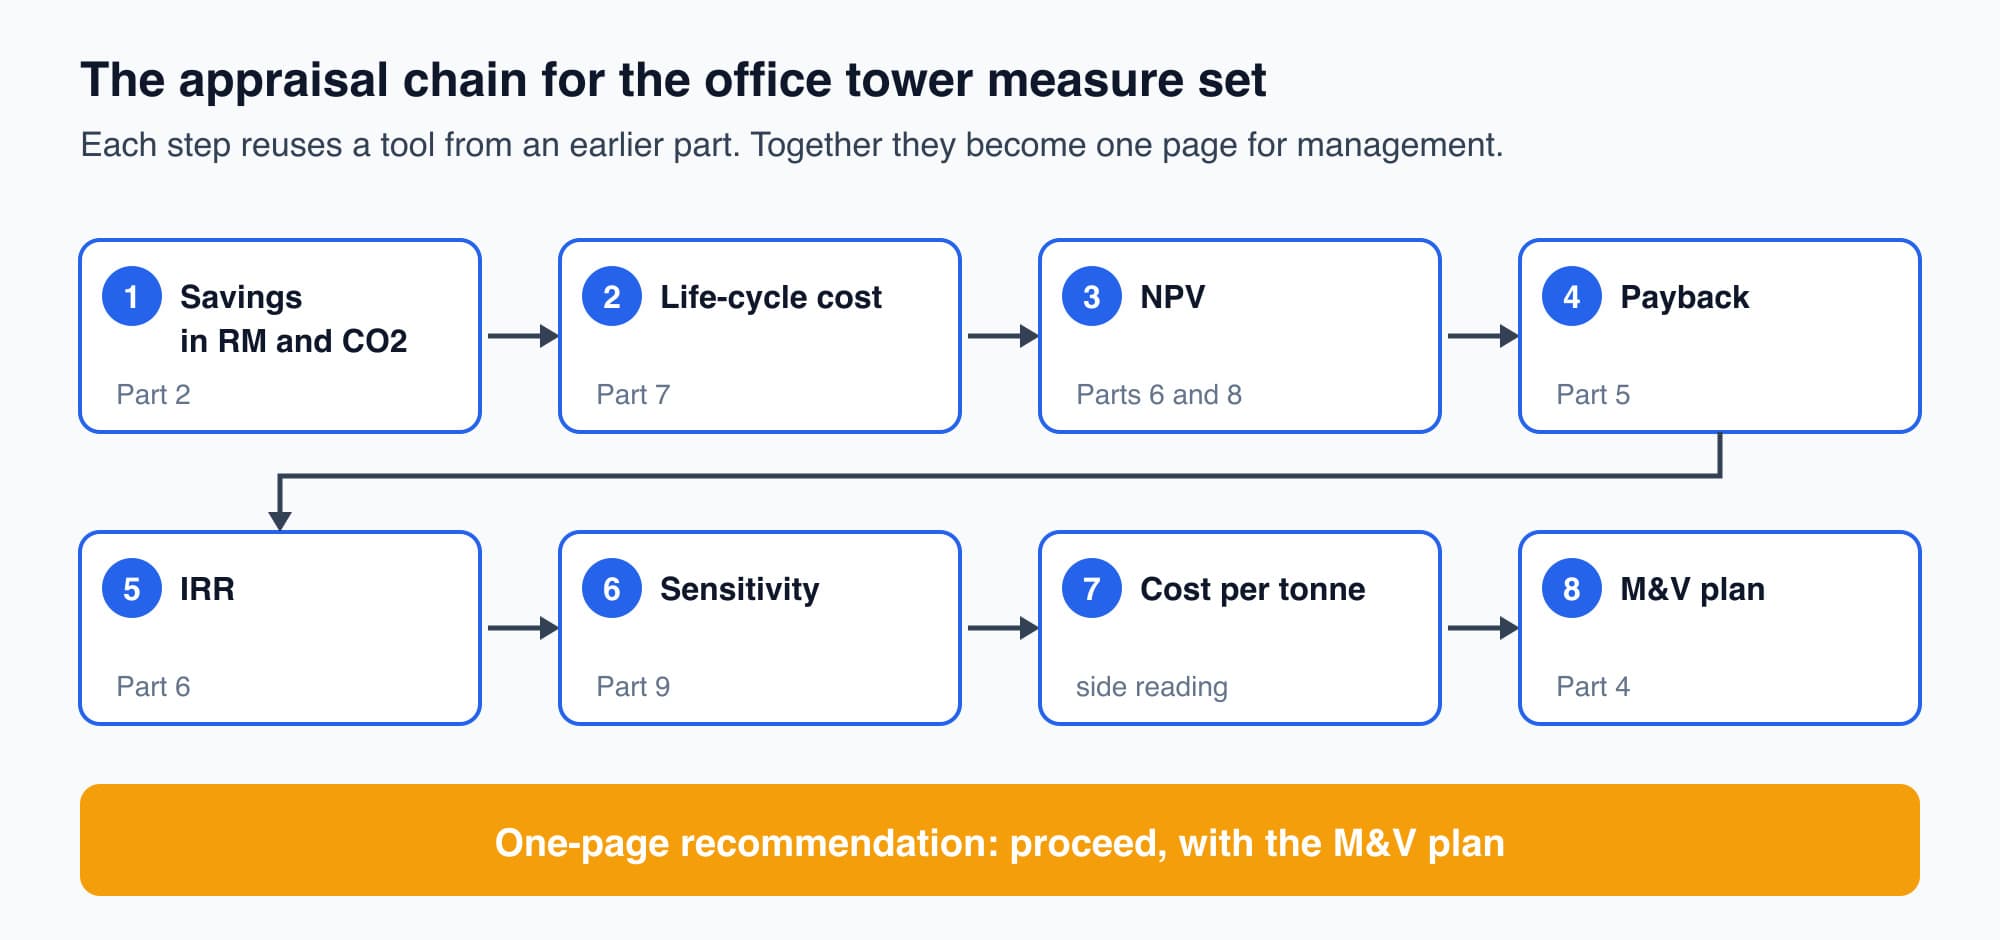
The appraisal chain: each step uses a tool from an earlier part of the course, and together they become one page for management.
Quantify the savings, in ringgit and in CO2
Part 2 valued each measure at the marginal rate: the price of the last kWh, not the average of the whole bill. For this tariff that is the energy charge plus the Automatic Fuel Adjustment (AFA): 29.83 + 3.67 = 33.50 sen/kWh, using the September 2026 AFA for every month. A demand saving counts only if the monthly peak really falls, at RM89.27 per kW each month. The retail charge never falls.
Measure | kWh saved a year | Ringgit a year (2027) | CO2e a year |
|---|---|---|---|
M1 chiller scheduling | 105,600 | RM35,376 | 78.1 t |
M2 condenser pump VSDs | 46,464 | RM15,565 | 34.4 t |
M3 demand limiting (100 kW off the MD) | 0 | RM107,124 | 0 |
Total | 152,064 | RM158,065 | 112.5 t |
Three details make these numbers believable:
- Overlapping measures are not simply added. M2 is counted only over the 11 core hours a day that remain after M1 has cut the plant's evening hours. On the old schedule one pump also ran from 6pm to 8pm; counting those hours for M2 too would have claimed 4,224 kWh a year that M1 already removes. When measures act on the same equipment or the same hours, value the second one after the first.
- M3 moves load rather than removing it, so it saves no kWh and claims no carbon. Its value is entirely the lower MD charge.
- Carbon uses the Peninsular grid emission factor of 0.740 kg CO2e per kWh (2024, provisional, Suruhanjaya Tenaga): 152,064 × 0.740 ≈ 112.5 tonnes a year.
All ringgit figures are before the KWTBB (Renewable Energy Fund) levy and tax. The kWh saving is about 2.5% of the building's annual use, which matters later for how the saving is proved.
Life-cycle cost: doing nothing is not free
Part 7 showed that life-cycle cost (LCC) compares two futures over the same period in today's money. Here the period is 10 years, the discount rate is 8% nominal (an illustrative rate, used with nominal cash flows), and electricity prices are assumed to rise 2% a year after the current RP4 tariff period ends in December 2027.
- Do nothing. The tower keeps paying about RM3,726,384 a year (twelve September-sized bills of RM310,532), rising 2% a year from Year 2. In today's money, ten years of that is about RM27,039,000.
- Do the measures. Spend RM130,000 now, pay the same bills minus the savings, and add RM8,000 a year (rising 3% a year) for M&V and upkeep. In today's money that is about RM26,083,000.
The difference between the two life-cycle costs is the NPV:
$$NPV = LCC_{\text{baseline}} - LCC_{\text{proposed}}$$
RM27,039,000 − RM26,083,000 ≈ RM956,000 (the unrounded figures give RM956,547). The measure set changes the tower's ten-year electricity cost by only about 3.5%, but in ringgit that is a large sum for a RM130,000 outlay.
Net present value
We can reach the same NPV directly from the savings, as in Part 8. The savings grow 2% a year, so we value them as a growing stream. In the formula, \(C\) is the Year 1 amount, \(r\) is the discount rate, \(g\) is the yearly growth and \(n\) is the number of years:
$$\text{PV}_{\text{savings}} = \frac{C}{r-g}\left[1-\left(\frac{1+g}{1+r}\right)^{n}\right] = \frac{158{,}065}{0.08-0.02}\left[1-\left(\frac{1.02}{1.08}\right)^{10}\right] \approx \text{RM}1{,}146{,}900$$
The same formula for the RM8,000 a year of upkeep, growing 3% a year, gives about RM60,400. Then:
$$\text{NPV} = \underbrace{1{,}146{,}900}{\text{PV of savings}} - \underbrace{60{,}400}{\text{PV of upkeep}} - \underbrace{130{,}000}_{\text{Capex}} \approx \text{RM}956{,}500$$
This matches the year-by-year table in Part 8. The NPV is strongly positive: after paying for the work and its upkeep, the owner is about RM956,500 better off in today's money than by doing nothing.
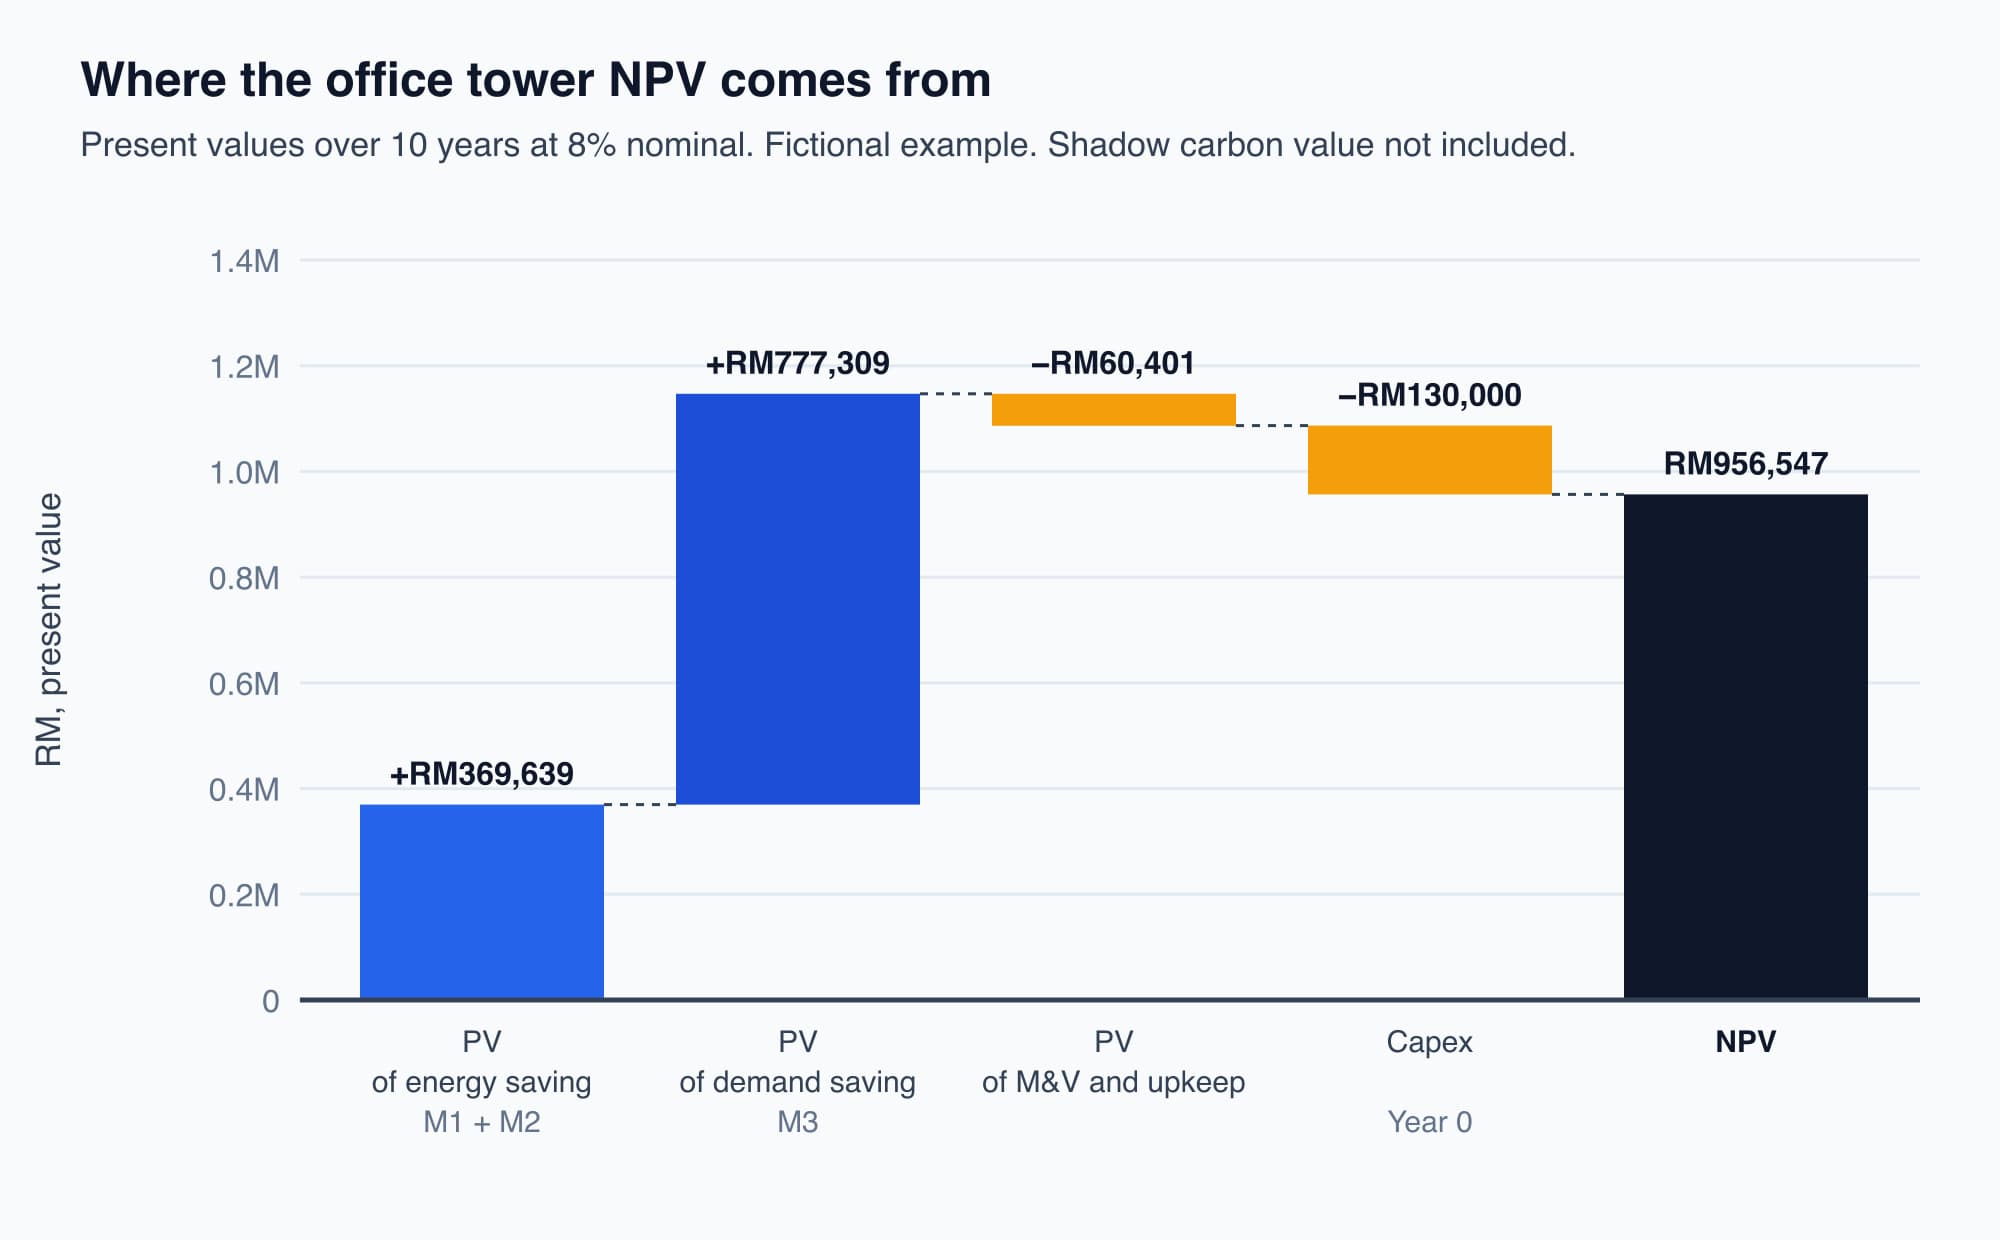
Where the NPV comes from: the demand saving from M3 is the largest single block, which is why the rest of the case checks it most carefully.
The carbon value is kept separate. If your company uses an internal (shadow) carbon price, say an illustrative RM50 per tonne, the tower's 112.5 tonnes a year are worth about RM5,630 a year, or about RM37,800 over ten years in today's money. That is a policy value, not cash, so it is not added to the NPV, payback or IRR. Show it on its own line.
Payback, simple and discounted
Simple payback divides the capex by the yearly net saving, and ignores the time value of money. It is a rough but widely understood check:
$$\text{Simple payback} = \frac{\text{Capex}}{\text{Annual net saving}} = \frac{130{,}000}{150{,}065} \approx 0.87\ \text{years}$$
The Year 1 net saving is RM158,065 − RM8,000 = RM150,065. So the money comes back in about 10 months, if the savings arrive evenly through the year. Using the discounted Year 1 figure (RM138,949), the discounted payback is about 0.94 years, about 11 months.
Controls measures such as scheduling and demand limiting often pay back quickly, because they change how existing equipment runs rather than replacing it. A chiller replacement would take far longer.
Internal rate of return
The internal rate of return (IRR) is the discount rate at which the NPV equals zero: the project's own built-in return. You compare it with the hurdle rate, the minimum return your company requires, here our 8%. Formally IRR solves:
$$0 = -\text{Capex} + \sum_{t=1}^{n}\frac{\text{Benefit}_t}{(1+\text{IRR})^t}$$
Here the benefit in each year is the net cash from the Part 8 table. Solving it by trial and error, as in Part 6, gives an IRR of about 117%. When the IRR is this far above the hurdle, small errors in it do not change the decision.
Sensitivity: what could break this?
Part 9 changed each input across a range and showed the results in a tornado diagram. The findings for management are:
- The M3 demand saving is the largest risk. If the BMS holds off 60 kW instead of 100 kW, the NPV falls to about RM645,600. If M3 delivers nothing at all, the NPV is still about RM179,200 and the payback is about 3 years.
- The discount rate comes second. Between 12% and 5%, the NPV ranges from about RM779,800 to RM1,125,900.
- Capex matters least. A 30% overrun (RM39,000) lowers the NPV by only about 4%.
- Scenarios. The low case (low savings, 30% overrun, no price rise) gives about RM458,300; the high case about RM1,204,400. The measure set does not lose money anywhere in that range.
The honest headline for management: the result depends mainly on whether the demand limiting really lowers the monthly peak, not on the construction cost.
Cost per tonne, and why you reduce before you offset
The optional side reading on the abatement cost curve ranks carbon measures by their cost per tonne avoided. To estimate it, spread the capex over 10 years with the capital recovery factor (CRF) from Part 7 (0.1490 at 8% over 10 years), add the yearly upkeep, subtract the yearly saving, and divide by the tonnes. Using Year 1 figures:
$$\text{Cost of abatement} = \frac{(130{,}000 \times 0.1490) + 8{,}000 - 158{,}065}{112.5} \approx -\text{RM}1{,}160/\text{tCO}_2$$
A negative cost means the measures save money while cutting carbon. On an abatement cost curve they sit at the far left, among the measures to do first. (This is a simplified estimate: it uses Year 1 savings, ignores escalation, and spreads the whole package's saving over the tonnes from M1 and M2, since M3 saves money but no tonnes.)
Malaysia has committed to net zero by 2050, and a widely used rule in net-zero planning is reduce first, offset last. Buying carbon credits for the same 112.5 tonnes would cost money every year (about RM5,630 a year at an illustrative RM50 per tonne). The measures instead save about RM150,065 a year, net of upkeep, while avoiding those tonnes. Credits are for the emissions you cannot remove by running the building better.
How the savings will be proved
Every figure so far is a forecast. The business case is only proven once measured savings confirm it, so the memo must say how that will be done. In Part 4 we wrote the measurement and verification (M&V) plan for this measure set:
- Periods. Baseline October 2025 to September 2026; installation October to December 2026; reporting period January to December 2027.
- M1 evidence. The chiller plant sub-meter: plant kWh from 6pm to 8pm on weekdays should be near zero, except for after-hours requests, which the BMS logs.
- M2 evidence. New meters on the two condenser pump feeders. The adjusted baseline is 54.0 kW × the actual run hours; the saving is that baseline minus the metered kWh.
- M3 evidence. Each month's MD from the TNB bill, cross-checked against the BMS log of the kW held off in that month's highest half-hour.
- Why sub-meters, not the bill. The saving is only about 2.5% of the building's use, which weather and occupancy can easily hide on the main bill. The whole-building bill is used as a cross-check, not as the proof.
- Changes agreed in advance. If a tenant adds or removes a server room or changes office hours, the facility manager records the date and metered load, and the baseline is adjusted by that load.
- Who owns the evidence. The tower's facility manager collects and files it monthly, with a report by the 10th of the following month. Finance signs off the annual savings figure.
The M&V and upkeep cost of RM8,000 a year is already in the cash-flow model. The measured figures come from the building's own meters, and the demand evidence is the same monthly MD that our maximum-demand calculator works with.
What a strong recommendation to management contains
Package the analysis so that a busy reader can decide from one page. For the office tower, the memo reads like this:
- Executive summary. "We ask for RM130,000 to reschedule the chiller plant, fit VSDs to the two condenser water pumps and add BMS demand limiting. The measures are expected to save about RM158,100 in 2027, repay their cost in under a year, and be proven by sub-metering during 2027. We recommend proceeding."
- Cash-flow picture. The Part 8 ten-year table, or its running-total chart.
- Key indicators, all at the 8% nominal hurdle:
Indicator | Office tower measure set |
|---|---|
Capex | RM130,000 |
Savings in 2027 | RM158,065 (RM50,941 energy, RM107,124 demand) |
NPV at 8% nominal, 10 years | about RM956,500 |
Simple / discounted payback | about 0.87 / 0.94 years |
IRR | about 117% |
Carbon avoided | 112.5 t CO2e a year (shadow value shown separately, not in cash) |
- Sensitivity findings. "The result depends mainly on the demand saving. If M3 delivers nothing, the NPV is still about RM179,200. A 30% capex overrun lowers the NPV by about 4%."
- Risks and mitigations. The demand limiting may not hold the peak (test through a hot month; monthly MD check). The AFA and tariffs may change (bands shown). Tenants may change hours (baseline adjustment agreed in advance). Savings may fade (monthly M&V report).
- Carbon impact and abatement cost. 112.5 t CO2e a year avoided at a negative cost per tonne.
- M&V plan. Reporting period January to December 2027; sub-metered evidence; facility manager owns the evidence; finance signs off.
- The final investment call: proceed.
What comes next
This is the end of the course. You can now take a saving from a TNB bill to a signed-off decision: value it at the marginal rate, prove it with an M&V plan, model it year by year, test it, and present it on one page. (For the underlying units, see kW versus kWh.)
If you work on a site with boilers or steam, the optional side reading on thermal savings applies the same thinking to fuel. From here, the natural next course is Cooling Fundamentals, where the same appraisal discipline meets the largest single load in most Malaysian buildings: the chiller plant.
Check your understanding
- Why does the office tower memo rely on sub-meters rather than the TNB bill to prove the kWh savings? The kWh saving is only about 2.5% of the building's annual use. Changes in weather and occupancy can easily be larger than that, so the main bill alone cannot show whether the measures worked. Sub-meters on the chiller plant and the condenser pump feeders measure the affected equipment directly; the bill is used only as a cross-check. The demand saving is checked against the bill's MD each month.
- The measures save about RM158,065 in 2027. Why does the payback use RM150,065? Payback should use the net saving: the savings minus the running cost the project adds. Here that is the RM8,000 a year for M&V and upkeep, so 158,065 − 8,000 = RM150,065. The shadow carbon value is not added, because it is not cash.
Recap: A credible energy efficiency business case is a chain: value the savings at the marginal rate, compare life-cycle costs, calculate NPV, payback and IRR, test the inputs, estimate the cost per tonne, and state how the saving will be proved. For the office tower measure set, RM130,000 of capex saves about RM158,065 in the first year, pays back in about 10 months, gives an NPV of about RM956,500 and an IRR of about 117% at an 8% nominal hurdle, and avoids 112.5 tonnes of CO2e a year at a negative cost. The case depends mainly on the demand saving, so the M&V plan checks it every month.
This is Part 10 of 10 in Cobler's Energy Management: The Economics of Saving Energy course. Previous: Sensitivity and Risk: Stress-Testing the Business Case.
Cobler builds CobiNeural, a platform that shows a facility team its building's energy, water and indoor air data as live numbers across the whole site. To see how your building performs, talk to us.
FAQ
Frequently asked questions
Ask us about this topic
Something in this article you want to dig into — or a situation in your own building it doesn't quite cover? Send us your question. We don't run public comments; the team replies to you directly by email.