Blog
Life-Cycle Costing: The Cheapest to Buy Is Often the Costliest to Own
Sticker price is a rounding error over 15 years. Learn life cycle costing for equipment — LCC, NPV, EAC and the CAPEX trap that hides the real lifetime bill.
 Tan Kok XinEnergy Management: The Economics of Saving Energy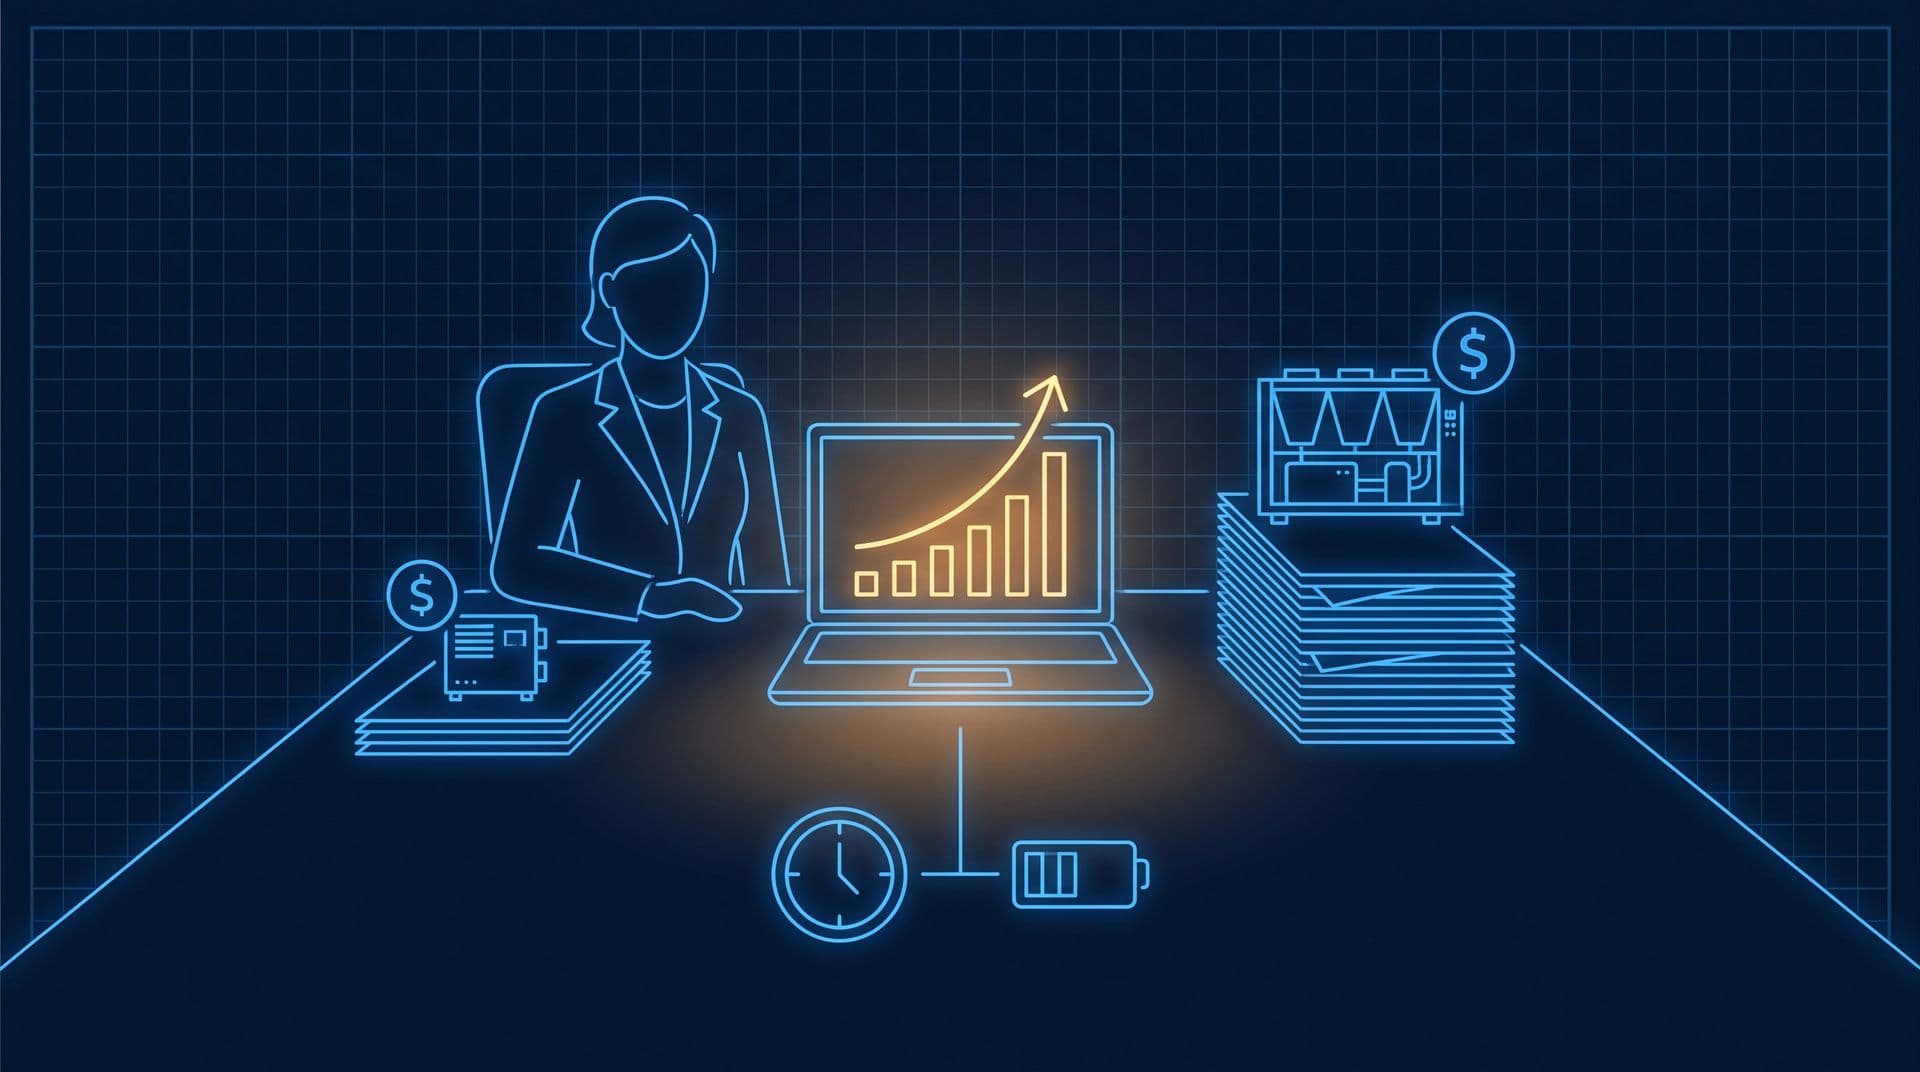
Part 7 of 10 in Cobler's Energy Management: The Economics of Saving Energy course. New here? See the course page.
Part 6 used discounting to value a stream of future savings, and the same method can add up the cost of owning a machine. When you buy an air conditioner for your home, the cheapest unit in the shop is not always the cheapest to own. Over the years, the electricity it uses can cost more than the unit itself. Buildings face the same choice on a much larger scale, with boilers, chillers, pumps and motors. So how do you compare a cheap machine with an expensive but efficient one?
Life cycle costing for equipment answers that question. It adds up what a machine costs to buy and to run over its whole life, with every future cost converted into today's money using the discounting method from Part 6. The option with the lower total wins. This part shows how to build that total, step by step.
The CAPEX trap: judging equipment by its price tag
Here is an industrial example. Two boiler quotations are on the table. The standard unit costs RM500,000. The high-efficiency unit costs RM750,000, which is 50% more. Most instincts, and many procurement rules, say buy the cheaper one and keep the RM250,000.
Now add the number that never appears on a quotation: the running cost. The efficient boiler burns less fuel, saving about RM250,000 per year. It recovers its RM250,000 price premium in about one year. Then it keeps saving RM250,000 a year for the remaining 14 years of its life. Before any discounting, choosing the "expensive" boiler is a RM3.5 million decision in your favour.
This is the CAPEX trap. CAPEX (capital expenditure) is the up-front price. The trap is judging equipment by that price when the running cost over its life is far larger. Life cycle costing avoids the trap by looking at the total cost of ownership: what the machine costs to own and run across its whole life, not only what it costs to buy.
For machines that move air, water or heat, running cost is the largest part
For equipment that moves air, water or heat, the purchase price is usually the small part of the total:
- Fuel can be more than 90% of a boiler's lifetime cost. The burner, the shell and the rest of the boiler are less than a tenth of the total.
- Electricity can be more than 95% of a motor's lifetime cost.
Here is a worked example with a motor. Take a 75 kW motor on an MV General account (Medium Voltage, the tariff of our example office tower). Suppose it really does deliver its full 75 kW output for 6,000 hours a year. Check this with a measurement before you rely on it: as Part 2 showed with the tower's condenser water pumps, the nameplate rating is not the same as the power a machine actually draws, and many motors run well below full load.
A motor's efficiency is the share of the electricity going in that comes out as useful work. An IE4 (super-premium efficiency) motor of this size is at least 96.0% efficient. To deliver 75 kW of output it draws 75 ÷ 0.96 = about 78.1 kW of electricity, or 468,750 kWh over 6,000 hours.
As Part 2 showed, a saved kWh on MV General is worth the energy rate plus AFA (Automatic Fuel Adjustment): 29.83 + 3.67 = 33.50 sen/kWh in September 2026. At that rate the motor uses about RM157,030 of electricity a year. Over a 15-year life that is about RM2.36 million, before discounting. The motor itself costs perhaps RM38,000. So electricity is about 98.4% of the lifetime total and the motor about 1.6%. Even after discounting at 8% a year (nominal), electricity is still about 97% of the total.
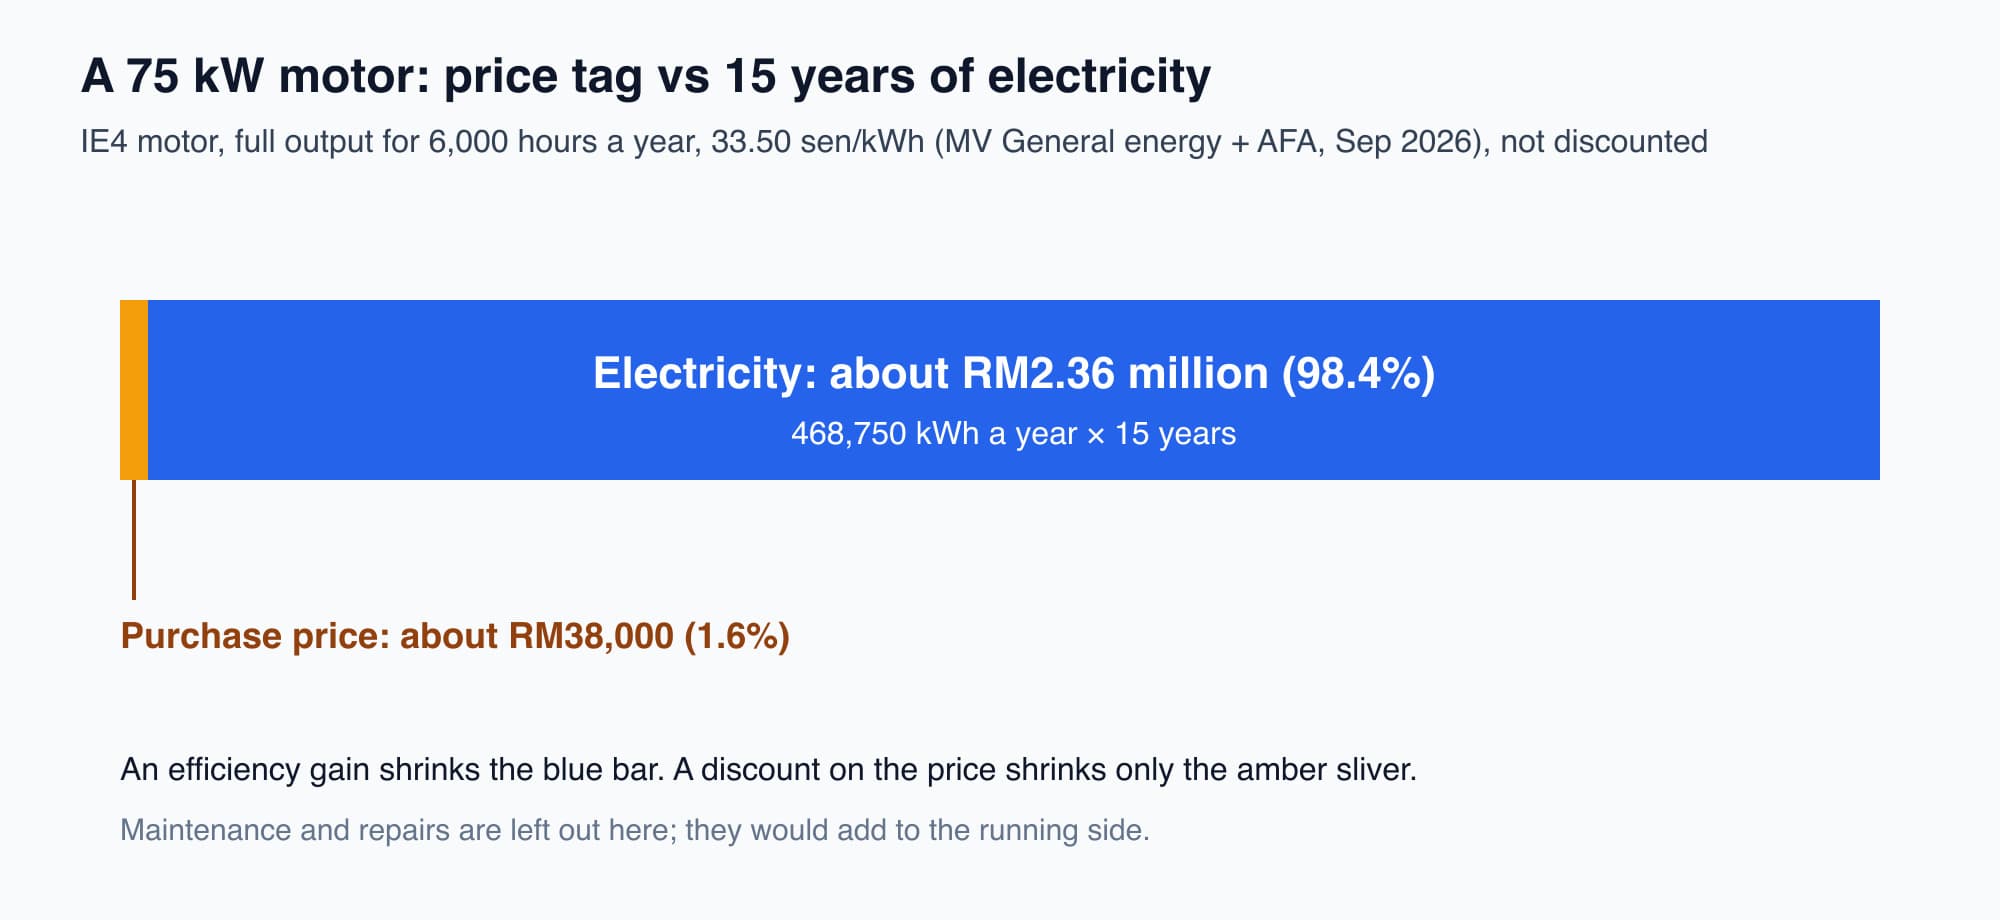
For a motor that runs most of the year, the electricity it uses dwarfs its price, so efficiency matters far more than a discount on the purchase.
This is why a small efficiency gain can be worth more than a large discount on the price. The efficiency gain reduces the lifetime electricity cost, which here is about 60 times the price of the motor. If kW and kWh still feel unclear, the Electricity Fundamentals primer on power vs energy covers the basics this part relies on.
In a building, this matters most for the chiller plant. In our example office tower, the chiller plant uses about 35% of the building's electricity, so a chiller bought on price alone is the CAPEX trap on a large scale.
IE3 vs IE4: a small efficiency gap that pays for itself
Now compare two versions of the same 75 kW motor. The minimum efficiencies come from the international standard IEC 60034-30-1 for a 4-pole, 50 Hz motor: IE3 (premium) 95.0% and IE4 (super-premium) 96.0%.
- IE3 at 95.0% efficiency: 78.95 kW input → 473,684 kWh a year → RM158,684 a year
- IE4 at 96.0% efficiency: 78.13 kW input → 468,750 kWh a year → RM157,031 a year
- Annual saving: about 4,934 kWh, or RM1,653 a year
The IE4 motor costs perhaps RM3,500 more to buy. Its simple payback (Part 5) is:
$$\text{Payback} = \frac{\text{extra capex}}{\text{annual saving}} = \frac{3{,}500}{1{,}653} \approx 2.12 \text{ years}$$
The extra cost is recovered in a little over two years, and the motor then keeps saving for about 13 more years. One percentage point of efficiency is worth thousands of ringgit because it applies to an electricity bill of over RM157,000 a year.
(The IE4 motor also draws about 0.82 kW less. If it runs during the building's highest half-hour of the month, that also lowers the maximum-demand charge, by up to 0.82 × RM89.27, about RM73 a month on MV General. We leave this out to keep the estimate cautious. Part 2 explained why a demand saving counts only if the monthly peak actually falls. If maximum demand is part of your equipment's cost, the maximum demand calculator helps size that part.)
The LCC formula adds every cost over the life, in today's money
The life cycle cost (LCC) adds the purchase price to every future cost, each discounted to today's value as in Part 6. For a machine bought now for capital cost $C_0$, over $n$ years at discount rate $r$:
$$LCC = C_0 + \sum_{t=1}^{n} \frac{E_t + M_t + R_t + K_t - S_t}{(1+r)^t}$$
The letters stand for the costs in year $t$:
- $E_t$ is the energy cost.
- $M_t$ is operations and maintenance.
- $R_t$ is mid-life replacement of parts.
- $K_t$ is any carbon cost you actually pay (see the section on carbon below).
- $S_t$ is the salvage value, what the old machine is worth at the end. It is a credit, so it is subtracted.
For two options that deliver the same service (the same cooling, the same pumped flow), the lower LCC wins.
When you compare an upgrade with carrying on as you are, the value of the upgrade is the gap between the two whole-life costs:
$$NPV = LCC_{\text{baseline}} - LCC_{\text{proposed}}$$
A positive NPV means the proposed option is cheaper to own over its life. This course uses an 8% a year nominal discount rate (with nominal cash flows) throughout. Choose a study period that matches the equipment's life: LED 5–8 years, solar PV 20–25 years, boilers and chillers 15–20 years.
Worked case: an economiser
This is another industrial example. An economiser recovers waste heat from a boiler's exhaust (flue) gas and uses it to preheat the water going into the boiler, so the boiler burns less fuel. The numbers:
- Capex: RM300,000
- Net annual saving: RM110,000 a year (fuel saved, minus the extra maintenance)
- Study period: 10 years at 8% a year, nominal
First, the annuity factor from Part 6: the present value of RM1 received every year for 10 years at 8%:
$$AF = \frac{1 - (1+r)^{-n}}{r} = \frac{1 - 1.08^{-10}}{0.08} = 6.7101$$
Present value of the savings:
$$PV_{\text{benefits}} = 110{,}000 \times 6.7101 = \text{RM}738{,}111$$
Net present value:
$$NPV = 738{,}111 - 300{,}000 = \text{RM}438{,}111$$
Benefit-cost ratio (BCR, from Part 6), the present value of the benefits per ringgit of capital:
$$BCR = \frac{PV_{\text{benefits}}}{C_0} = \frac{738{,}111}{300{,}000} = 2.46$$
And the simple payback:
$$\text{Payback} = \frac{300{,}000}{110{,}000} = 2.73 \text{ years}$$
So the NPV is +RM438,111, the BCR is 2.46 (RM2.46 back for every RM1 spent) and the simple payback is 2.73 years. All three describe the same cash flow, and all three point the same way. A project that returns nearly two and a half times its cost in present-value terms is an investment, not just a maintenance expense.
Different lifetimes: compare the equivalent annual cost
LCC and NPV compare options fairly only when they last the same number of years. A VSD (variable speed drive) retrofit that lasts 10 years and a chiller replacement that lasts 20 years cannot be compared on total cost. The 20-year option looks more expensive partly because it buys twice as many years of service.
The equivalent annual cost (EAC) fixes this. It spreads each option's whole-life cost into an equal yearly amount, using the capital recovery factor (CRF):
$$CRF = \frac{r(1+r)^n}{(1+r)^n - 1}$$
$$EAC = LCC \times CRF$$
At 8% a year, the CRF is 0.1490 over 10 years and 0.1019 over 20 years. Compare:
- Option A: LCC RM800,000 over 10 years → EAC = 800,000 × 0.1490 = RM119,200 a year
- Option B: LCC RM1,000,000 over 20 years → EAC = 1,000,000 × 0.1019 = RM101,900 a year
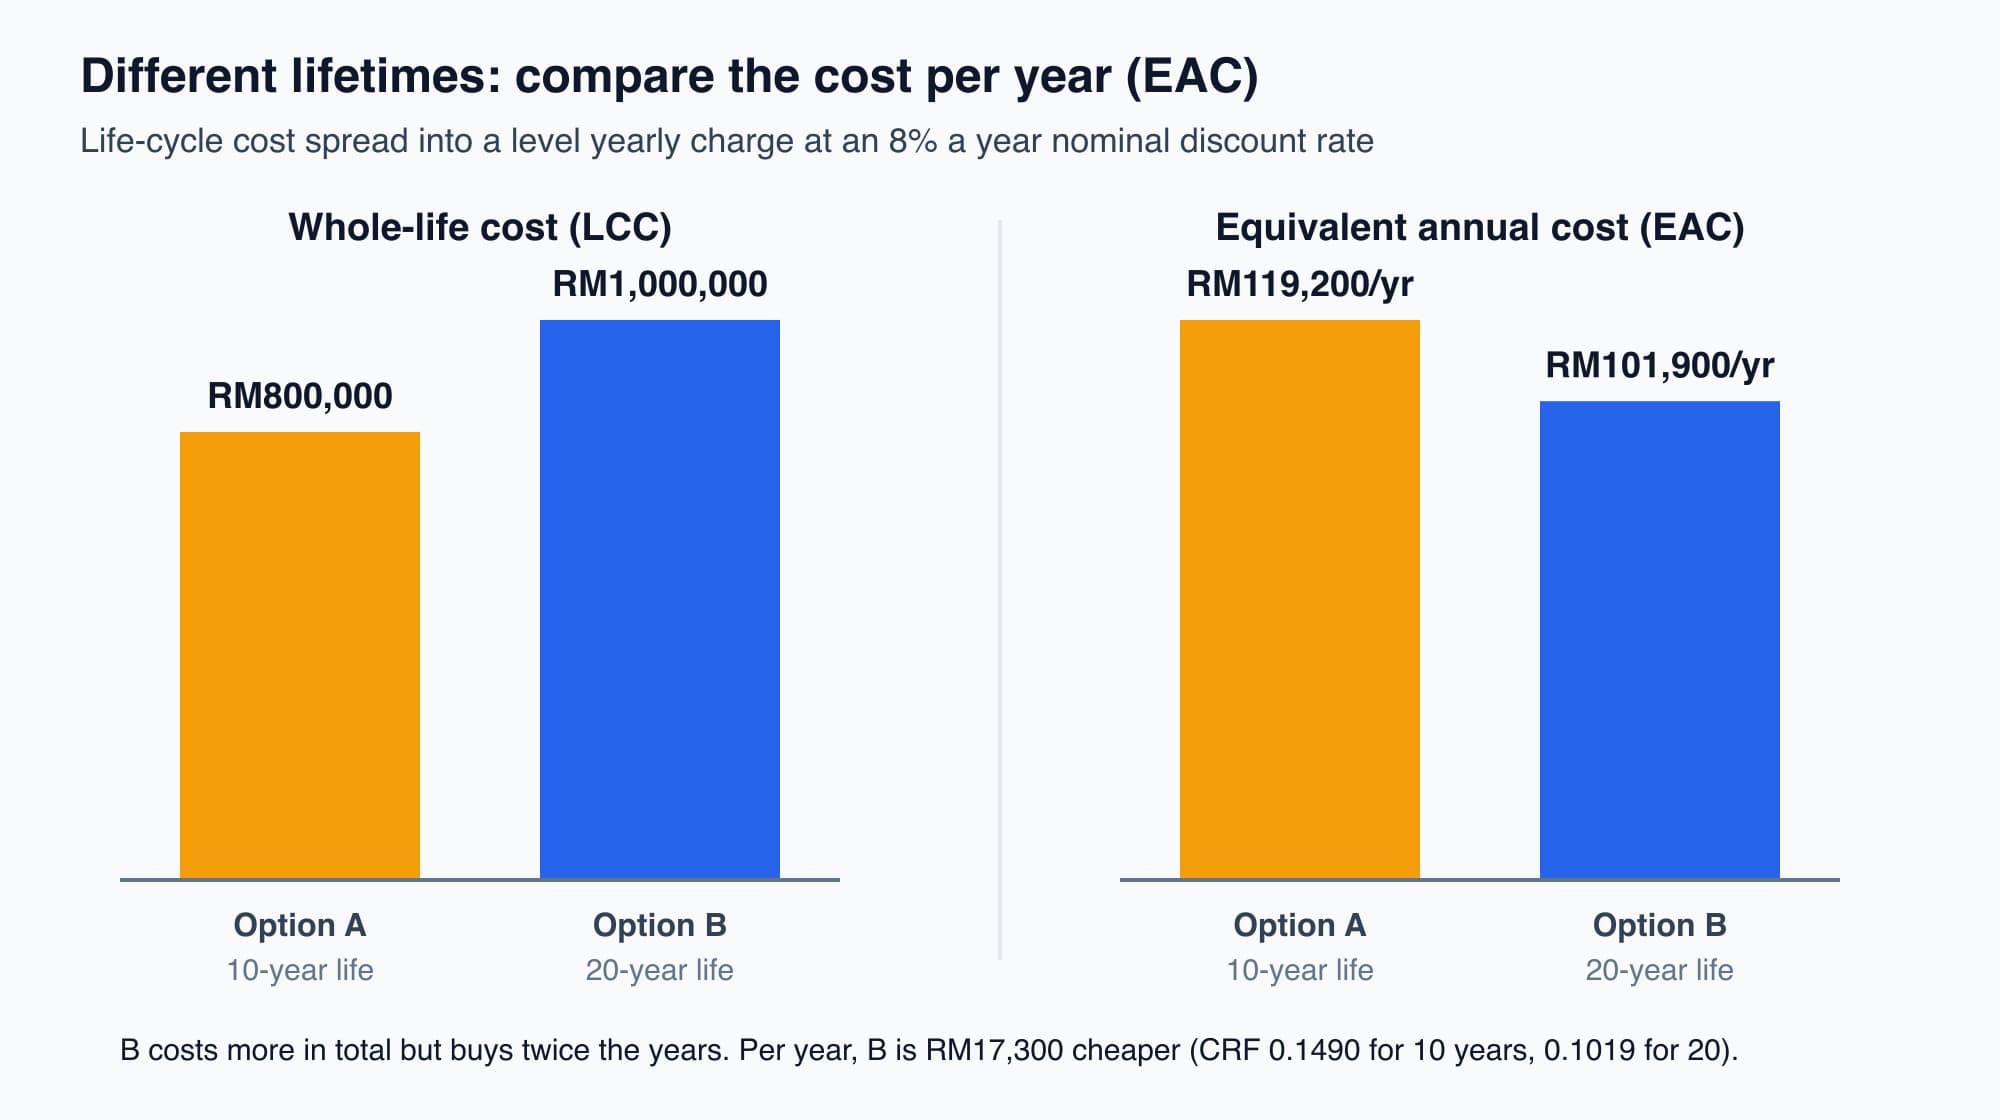
Option B costs more in total but less per year of service, because its cost is spread over twice as many years.
Option B has the higher lifetime cost but the lower yearly cost. Compared year for year, B is cheaper by RM17,300 a year. Whenever two options have different lives, compare EAC, not LCC.
Include the parts you will replace mid-life
The most common LCC error is to assume the equipment runs for 15 years with no parts replaced. In practice, components wear out and must be replaced partway through the equipment's life, and those replacements are real future costs:
- Variable speed drives (VSDs): replaced every 8–12 years
- LED drivers: every 4–6 years (the LEDs last longer than the electronics that power them)
- Boiler refractory (the heat-resistant lining): relined every 5–7 years
Over an asset's life, these mid-life replacements typically make up 5–20% of total LCC. A spreadsheet built only from the purchase quote leaves them out and understates the true life cycle cost by the same amount. That makes an option with a low price but expensive replacement parts look better than it is.
Count carbon only when it is a real cost
The $K_t$ term is for a carbon cost you will actually pay. Malaysia has announced a carbon tax for the iron, steel and energy sectors. As of mid-2026, no rate had been gazetted and the timeline was under review; figures from RM15 to RM35–45 per tonne of CO₂ have been discussed, but none is official (our carbon tax guide tracks the latest). For an office building today, $K_t$ is therefore zero.
Some companies set an internal carbon price to guide decisions. That is not cash. If you use one, keep the LCC with real cash costs as your main result, and show a second LCC with the internal carbon price added, clearly labelled. A carbon price, real or internal, adds more to the less efficient option, because it uses more energy.
What comes next: the year-by-year cash-flow model
LCC compares ways of buying and running equipment. A full business case also needs the savings, costs and replacements laid out year by year for the measures you plan to install. The next part, Building an Energy Project Cash-Flow Model, builds that model for our example office tower and calculates its NPV. The model is only as good as its energy figures, so it uses the baseline and measured savings from Parts 2 to 4 rather than guesses.
Check your understanding
- Two pumps give the same flow for 15 years. Pump X costs RM20,000 and has an LCC of RM400,000. Pump Y costs RM28,000 and has an LCC of RM370,000. Which should you buy? Pump Y. Both deliver the same service over the same life, so the lower LCC wins. Y costs RM8,000 more to buy but RM30,000 less to own over its life, in today's money.
- Why do you need EAC rather than LCC to compare a 10-year option with a 20-year option? The 20-year option's LCC covers twice as many years of service, so its total looks larger even if it is better value. EAC turns each LCC into an equal yearly cost using the capital recovery factor, so the two can be compared year for year.
Recap: Buy on total cost of ownership, not on price. For machines that run most of the year, running cost is by far the largest part: electricity can be more than 95% of a motor's lifetime cost. A small efficiency gain (IE3 95.0% to IE4 96.0%) can repay its extra price in about two years. LCC is the purchase price plus the discounted energy, maintenance, replacement and any real carbon costs, minus salvage, at 8% a year nominal in this course. For equal service, the lower LCC wins. Use EAC when lifetimes differ, include mid-life replacements, and keep any internal carbon price separate from cash.
This is Part 7 of 10 in Cobler's Energy Management: The Economics of Saving Energy course. Previous: The Time Value of Money: NPV and IRR Explained Simply. Next: Building an Energy Project Cash-Flow Model.
Cobler builds CobiNeural, a platform that shows a facility team its building's energy, water and indoor air data as live numbers across the whole site. To see how your building performs, talk to us.
FAQ
Frequently asked questions
Ask us about this topic
Something in this article you want to dig into — or a situation in your own building it doesn't quite cover? Send us your question. We don't run public comments; the team replies to you directly by email.