From Sensor to Decision: How Energy Data Works
A meter reading changes nothing on its own. Here's the path from sensor to saved money - measurement, connectivity, structure, analytics, action - and where sites lose the value.

From sensor to decision: how energy data becomes something you can act on
A meter reading on its own changes nothing. For energy data to cut a bill or pass an audit, it has to travel a path: a sensor measures something physical, that reading gets off the equipment and onto a network, a platform stores and makes sense of it, analytics turn it into an insight, and someone (or the system itself) acts. Break any link in that chain and the data is just numbers nobody uses. This is the journey, step by step, and where most sites lose the value.
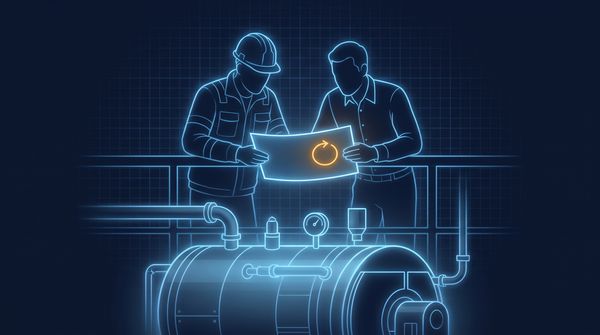
Step 1: measurement (you can only manage what you meter)
The chain starts at the sensor, and the quality of everything downstream is capped here. A power meter measures energy, demand and power factor at a board. A temperature and flow sensor on a chilled-water loop is what lets you calculate plant efficiency. A CO₂ sensor reports indoor air quality.
The common failure is metering only the main incomer. A single whole-building meter tells you that you used 80,000 kWh last month; it can't tell you where it went. To act, you need measurement at the right granularity: major equipment and distribution boards, not just the front door. We make this case in sub-metering to find energy problems: the sensor layer is the data spine, and skimping on it can't be recovered by clever software later.
Step 2: connectivity (getting the reading off the equipment)
A reading stuck inside a meter in a switch room is useless. It has to reach a platform. Most industrial meters publish their data over Modbus, the standard wired industrial protocol, and building controllers over BACnet. That works well where the equipment is near a network.
The hard case is meters scattered across a large or old site where pulling data cable is expensive or impossible. That's where LoRaWAN comes in: a long-range, low-power wireless link that carries meter readings several kilometres across a facility with no trenching and no SIM per device. A LoRaWAN Modbus controller polls each meter and transmits its readings to a gateway, turning a cabinet of wired meters into a wireless feed. Connectivity is the plumbing; without it, the measurement never becomes data.
Step 3: ingestion and structure (turning readings into a model)
Raw readings arrive in a mess: different units, different labels, different structures from each vendor's equipment. Before anything useful can happen, the platform has to normalise them into a consistent model.
A Smart Operation Platform organises data hierarchically: locations (sites, buildings, zones) → equipment (chillers, compressors, pumps) → sensors. Once a reading is mapped into that structure, a number on a dashboard can always be traced back to the asset that produced it. This is the step that makes a fragmented multi-vendor estate legible: a chiller is a chiller whether it's on one brand of BMS or another. CobiNeural does this normalisation as it ingests, which is what lets it sit as an overlay across systems that don't otherwise talk to each other.
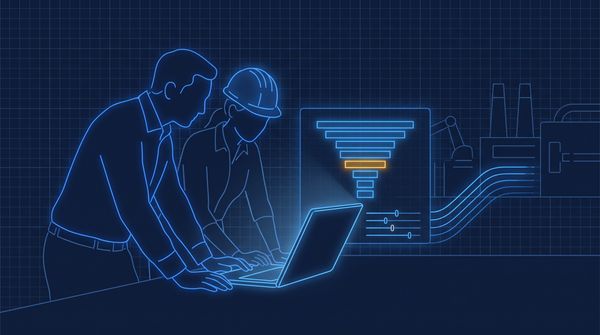
Step 4: analytics (from data to insight)
Structured data is still not a decision. The analytics layer is where readings become meaning:
- Trends and profiles: what normal looks like for this equipment, this time of day, this weather.
- KPIs: maximum demand, kW/RT for a chiller plant, EUI for a building, power factor.
- Anomaly detection: flagging the reading that doesn't fit the pattern: a chiller running out of schedule, a compressor drawing more than its load demands. We explain the mechanism in what energy anomaly detection does.
The shift here is from raw to relative. "412 kW right now" means little. "412 kW, which is 18% above the same load last week and is setting today's billed peak" is an insight you can act on.
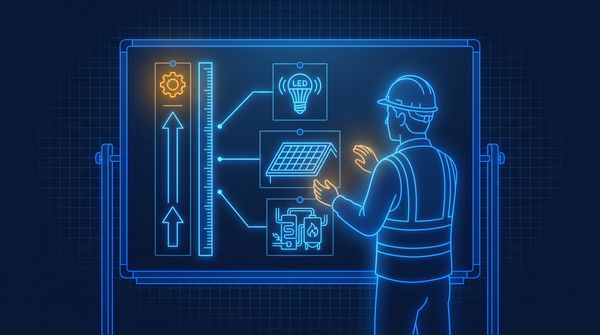
Step 5: decision and action (closing the loop)
The chain only pays off when the insight changes something. That action takes one of three forms:
1. A human acts. An alert reaches the on-call engineer by WhatsApp or email (a surge, an anomaly, a peak forming) and they intervene: stagger a start, reset a setpoint, investigate a fault.
2. The system acts. Through the automation layer, the platform pushes a control action back down to the BMS, PLC or SCADA (staging plant, shifting deferrable load out of the costly peak window), closing the loop without waiting for a person.
3. The record acts. The data becomes an EECA report, an ISO 50001 entry, or a tenant cost allocation: evidence and accountability rather than real-time control.
This is the difference between monitoring and management. Monitoring shows you the number. Management is when the number reliably leads to an action that moves the bill or satisfies the auditor.
Where sites lose the value
Most facilities don't fail at one dramatic point; they leak value at the joints:
- Metering too coarse (Step 1): you see totals, not causes.
- Data trapped in silos (Steps 2–3): each system has its own screen, nobody reads across them.
- Numbers without context (Step 4): dashboards full of live values but no sense of what's abnormal.
- No closed loop (Step 5): insights that never reach the person or system that could act.
A Smart Operation Platform exists to hold the whole chain together (sensor to decision) so the data you're already generating actually turns into a lower bill and a cleaner audit. You can see the full chain at work across real sites in our case studies, or book a walkthrough to trace it for your own building.