Blog
BEI Malaysia: Scoring Your Building's Cooling by Measuring It
What Malaysia's Building Energy Index and MS1525 reveal about the hidden cooling waste in a building that feels perfectly fine — and why you can't fix a plant you don't…
 Tan Kok XinCooling Fundamentals
Part 16 of 20 in Cobler's Cooling Fundamentals course. New here? See the course page.
Part 15 showed that a nameplate or an IPLV cannot tell you what your plant is doing today. So how do you find out how well your cooling is really performing? You measure it.
A poorly run building can feel perfectly fine on a hot afternoon: cool, quiet and comfortable. Down in the plant room, though, the chillers may be using far more electricity than they need, pumps may be running at full speed for no reason, and a fouled condenser may be adding to every kilowatt-hour. None of this reaches the people upstairs. It shows up only as an electricity bill that is larger than it should be.
This part explains what to measure (flow, temperature and power), how to turn those readings into the kW per ton from Part 13, how to prove that a change saved energy, and how the Building Energy Index (BEI) scores the whole building.
Two numbers you need, and why you usually cannot see them
To grade a cooling plant you need two numbers at the same moment:
- The cooling delivered, in kW or RT (refrigeration tons; 1 RT = 3.517 kW of cooling, from Part 5).
- The electricity used by the plant, in kW.
Divide the second by the first and you get the plant's real kW per ton. Earlier parts used figures like kW per ton, delta-T and part-load efficiency as if you could read them off a dial. In most buildings you cannot. There is no gauge that shows them. They have to be calculated from three kinds of measurement: flow, temperature and power.
Measure the cooling delivered with flow and temperature
The chilled water carries heat from the building back to the chillers. As Part 9 showed, the cooling it carries is the water flow multiplied by how much the water warms up on its trip around the building:
$$Q_{\text{cooling}}\ (\text{kW}) = \text{flow (L/s)} \times 4.19 \times \Delta T\ (^\circ\text{C})$$
To use it on a real plant you need:
- A flow meter on the chilled-water pipe, to measure how many litres per second are moving.
- Temperature sensors on the supply and return pipes, to measure delta-T.
Suppose that on a hot afternoon the office tower's meters read:
- flow: 126 L/s
- supply: 6.0 °C, return: 12.0 °C
The cooling delivered is 126 × 4.19 × 6, about 3,170 kW. Dividing by 3.517 gives about 900 RT, which is the building's peak cooling load.
The two temperature sensors need to be accurate and checked against each other. Part 17 uses these same two sensors to spot a common fault called low delta-T.
Measure the electricity used with power meters
The other half of the ratio is the electricity. For this you need power and energy (kWh) meters on the plant's electrical supply. How electricity meters work explains what these meters record.
Decide first what you are measuring. As Part 13 explained, a chiller-only figure counts only the chillers. A whole-plant figure also counts the chilled-water pumps, condenser-water pumps and cooling-tower fans. The whole-plant figure is the one your bill follows, so meter all of them, or meter the plant's switchboard as a whole. The office tower has a sub-meter on its chiller plant for this reason.
Suppose the plant meter reads 855 kW at the same moment as the flow and temperature readings above. Then:
- kW per ton = 855 ÷ 900, about 0.95 kW/RT
- COP = 3,170 ÷ 855, about 3.7
That matches the office tower's measured figure of 0.95 kW/RT against its design target of 0.85. The gap between the two is waste you can now see and put a number on. Remember from Part 13 to compare a whole-plant measurement only with whole-plant figures, not with a chiller's nameplate.
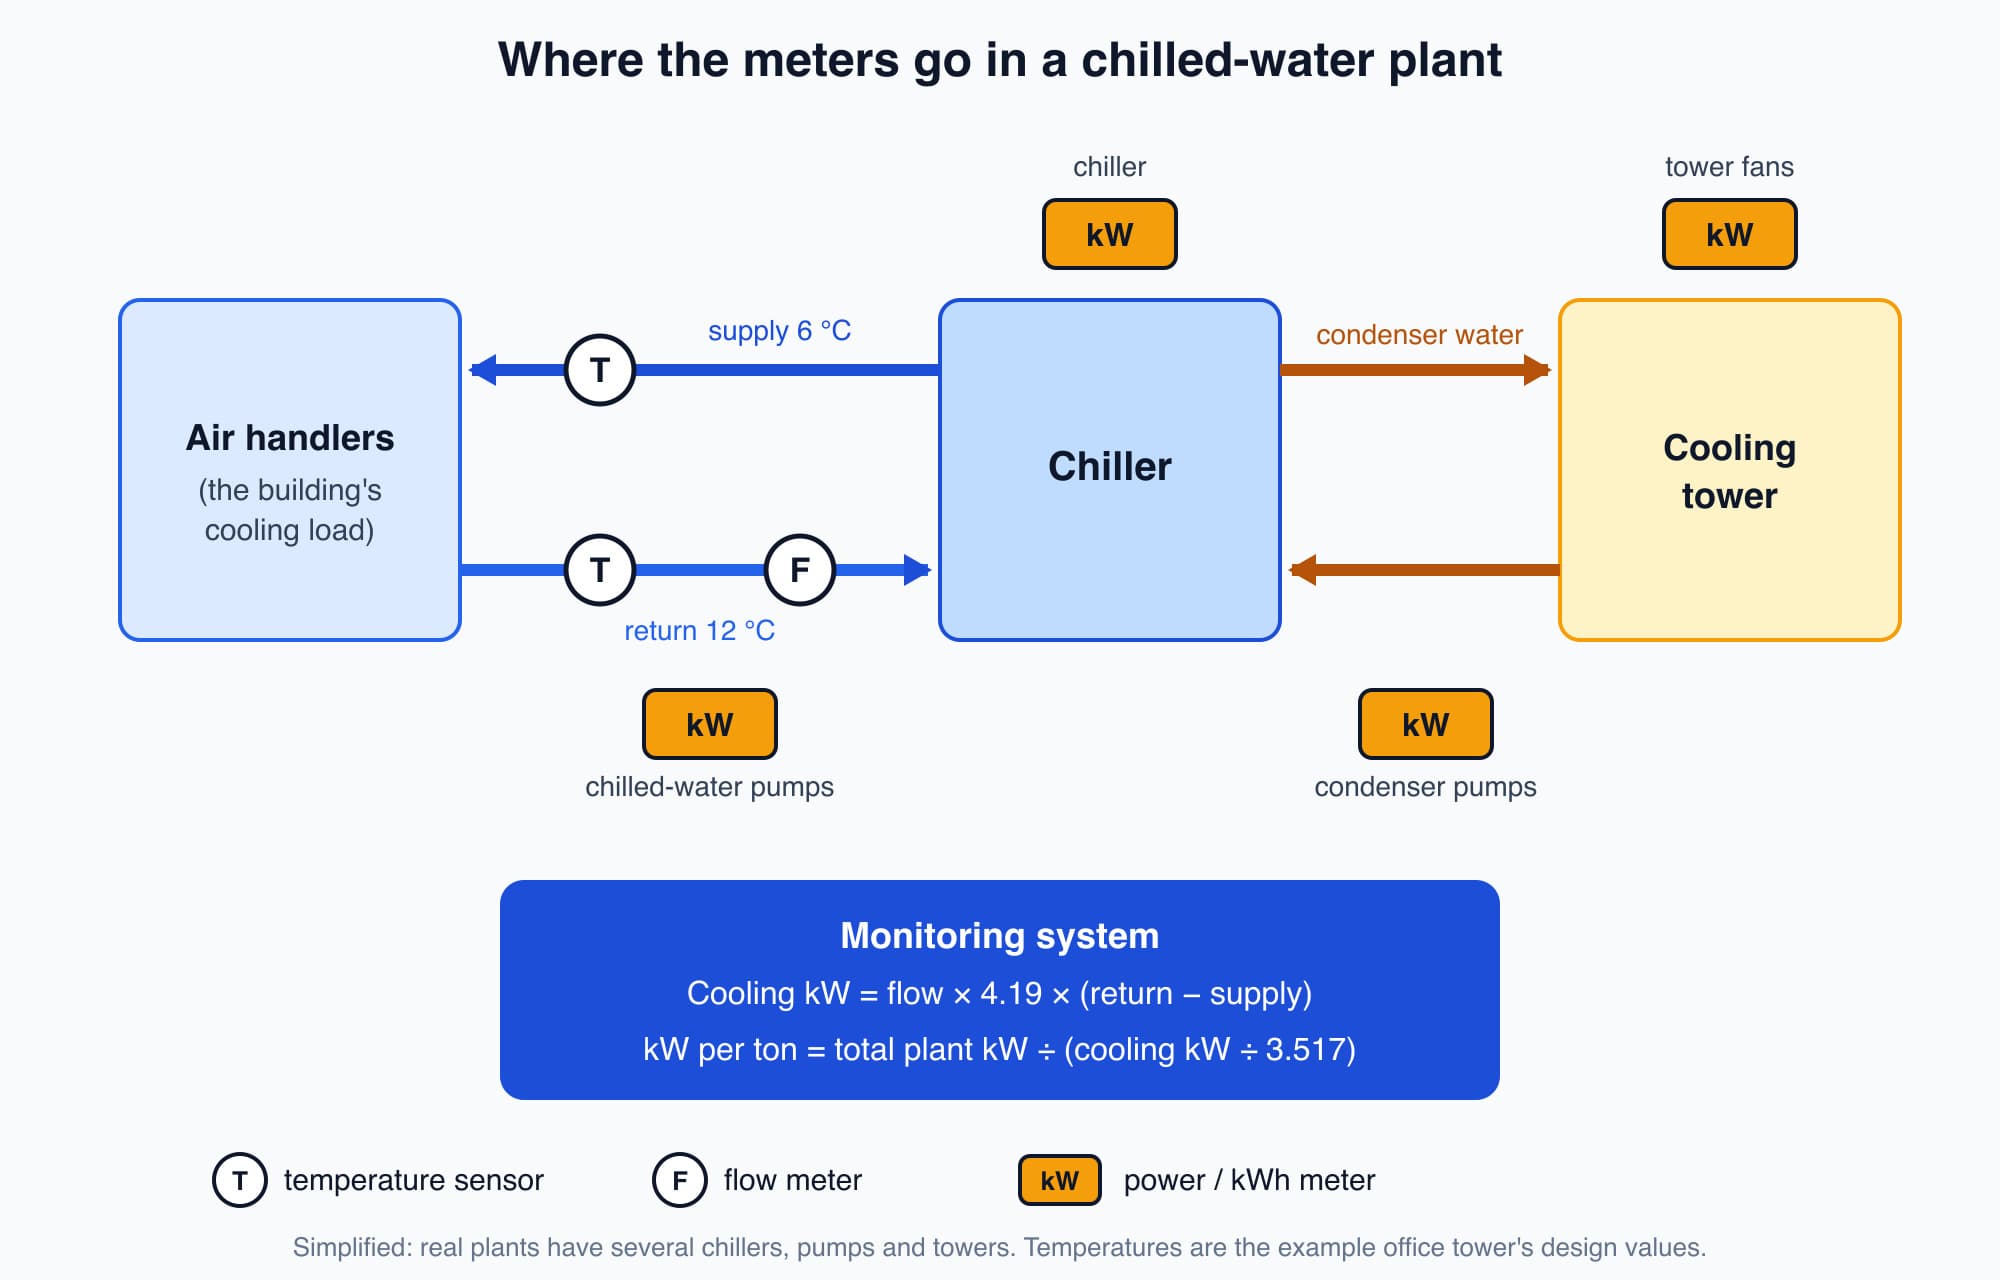
Three kinds of measurement feed one calculation: flow and delta-T give the cooling delivered, the power meters give the electricity used, and the ratio is the real kW per ton.
Follow the numbers over time
One set of readings tells you where the plant is at one moment. It does not tell you whether that is normal. Efficiency changes with the load, the weather and the slow fouling of heat exchangers, as Part 15 explained.
So the readings need to be collected continuously, for example every 15 minutes, and stored. A monitoring system then does the arithmetic from the previous two sections for every interval. With that record you can:
- see a trend, such as kW per ton slowly rising over months as tubes foul,
- compare like with like, such as this month's hot afternoons against last month's, and
- get an alert when something changes suddenly, such as delta-T falling after a valve fault.
This is the same idea as the electricity meter at your incoming supply, applied inside the plant.
(If your building has split units and cassettes, like the shoplot, there is no chilled-water pipe to put a flow meter on. The practical step is to sub-meter the air-conditioning circuits and compare their kWh with room temperatures and operating hours over time.)
Prove a change with measurement and verification
Once you can measure, you can check whether a change really saved energy. The method is called measurement and verification (M&V):
- Baseline. Before you change anything, record how much energy the plant uses (in kWh) over a representative period, together with the things that affect it, such as outdoor temperature, occupancy and operating hours.
- Make one change. For example, reset the chilled-water temperature, fix a low delta-T, enable variable-speed pumping or correct the chiller staging.
- Measure again and compare. Record the energy use after the change, adjust for any difference in weather and occupancy between the two periods, and show the saving in kWh.
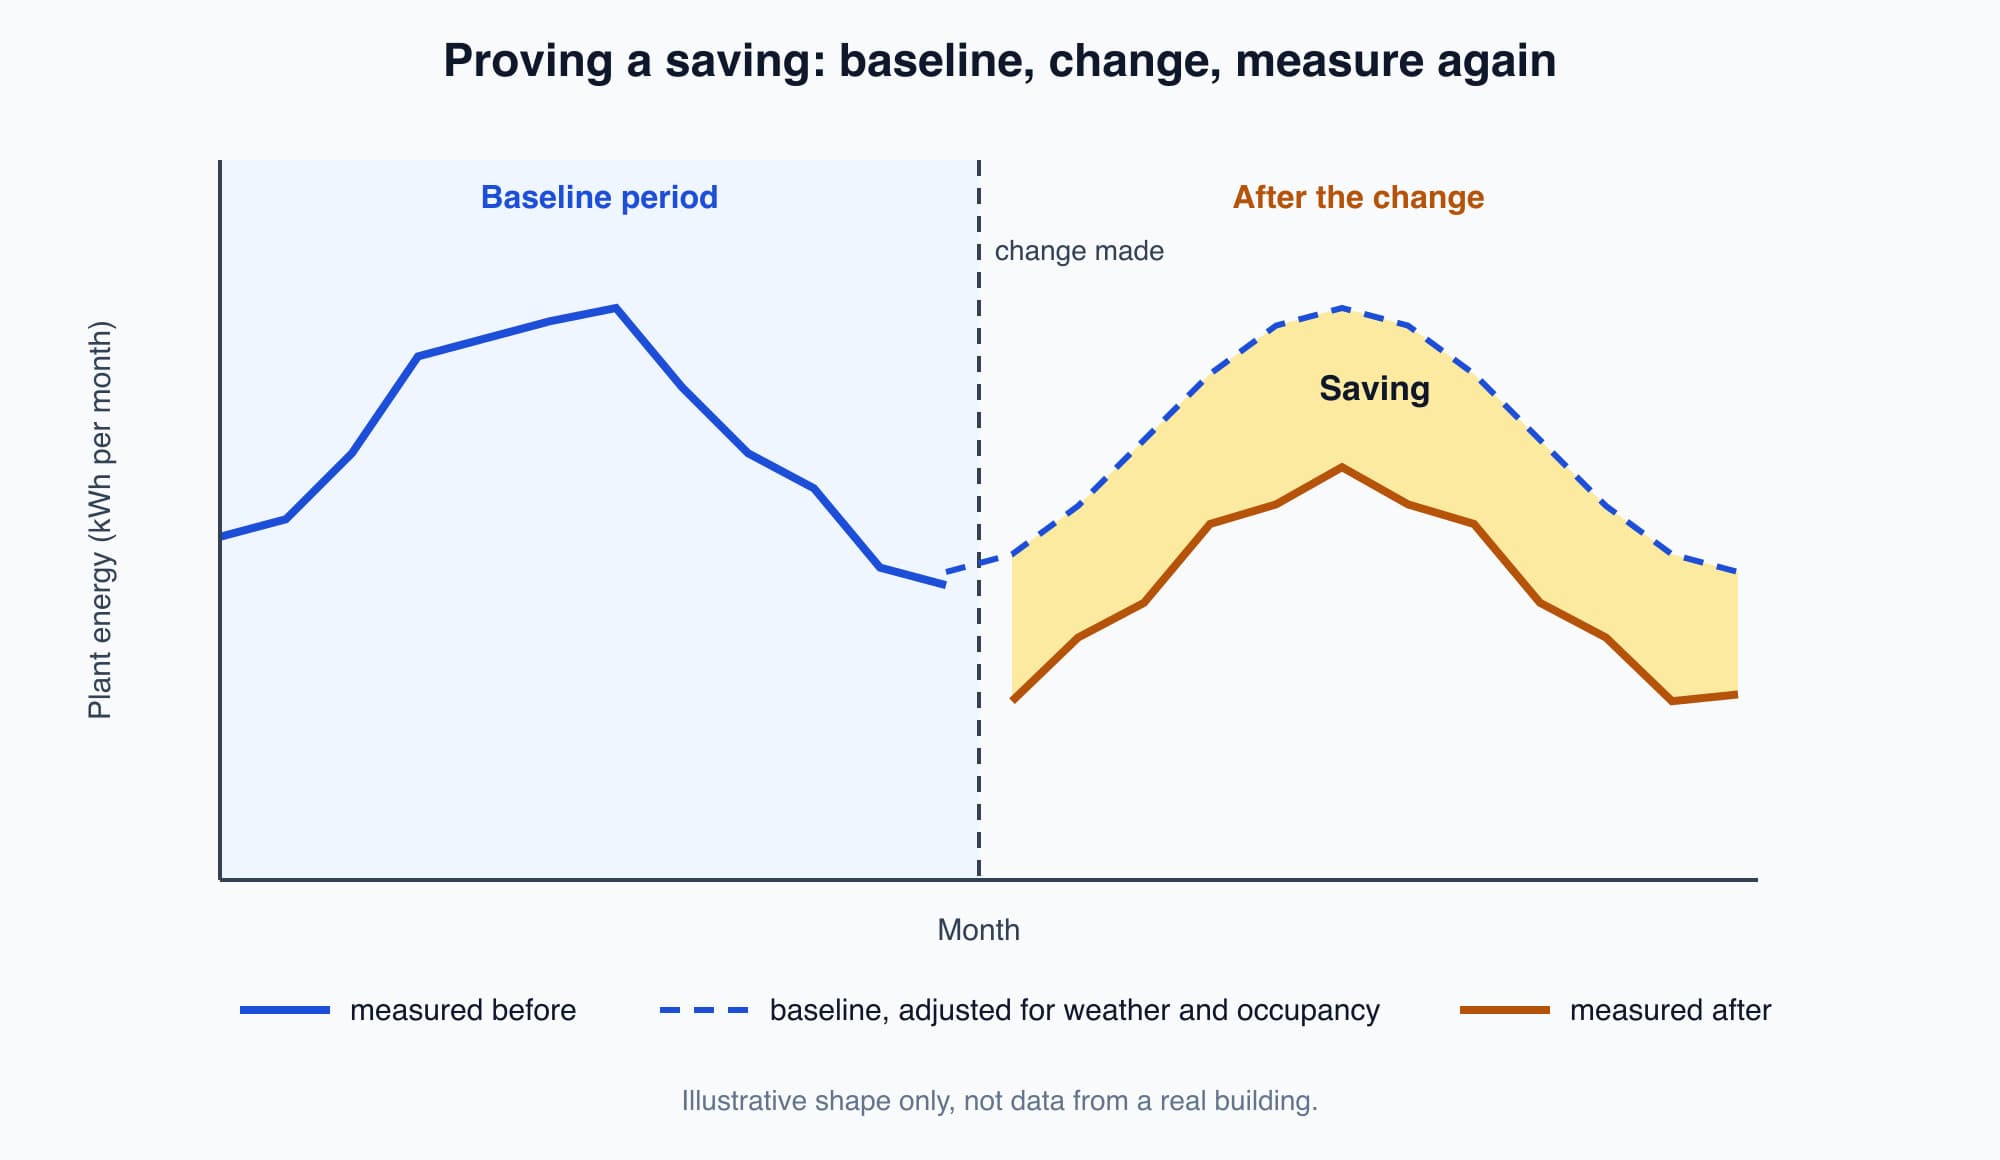
The saving is the gap between what the plant would have used (the baseline, adjusted for weather and occupancy) and what it actually used after the change.
The third step is the one most often skipped. The building feels just as cool before and after, so there is no other feedback. "We changed the settings and it feels better" is not evidence. "Plant consumption dropped 14% after adjusting for weather, and stayed there for three months" is.
How a saving turns into ringgit depends on the tariff. On a Medium Voltage tariff like the office tower's, a saving can cut both the energy charge and, if it lowers the month's highest half-hour, the demand charge; on a Low Voltage tariff like the shoplot's, it comes only through kWh. Part 14 explains these charges.
BEI, the score for the whole building
Everything so far measures the cooling plant. There is also a single score for the whole building: the Building Energy Index, or BEI, also called building energy intensity.
$$\text{BEI} = \frac{\text{total annual building energy (kWh)}}{\text{gross floor area (m}^2)}$$
The result is in kWh/m²/year: kilowatt-hours used per square metre of floor per year. Dividing by floor area lets you compare buildings of different sizes. A 40,000 m² tower will always use more kWh than a 10,000 m² one, but the two can be compared per square metre.
The office tower uses about 6,000,000 kWh a year over 30,000 m² of gross floor area (not counting the car park), so its BEI is 6,000,000 ÷ 30,000 = 200 kWh/m²/year.
Rough reference points, which change with building type and with the edition of the guidance you use:
- Typical Malaysian offices are often quoted at roughly 200 to 250 kWh/m²/year.
- A few national showcase green buildings report roughly 30 to 90 kWh/m²/year.
Two BEI figures are only comparable if they are worked out the same way: some schemes remove car-park energy and floor area, or adjust for operating hours. Our BEI guide explains the Malaysian definitions and labelling.
What BEI can and cannot tell you
In an air-conditioned Malaysian office, cooling typically takes roughly 40 to 60% of the electricity (Part 14). So cooling has the biggest effect on BEI. Replacing every light with LEDs saves a few percent; the large gap between a typical building and a showcase one is mostly in the plant room.
But BEI is an annual total for the whole building. It tells you how much energy the building uses. It does not tell you why, or where. A high BEI does not show whether the cause is a low delta-T, badly staged chillers or long operating hours. For that you need the plant measurements described earlier in this lesson.
So the two work together: BEI is the score, and flow, temperature and power are how you find out what is behind it.
Worth knowing: Small sensor errors matter. On a delta-T of 6 °C, a temperature error of just 0.3 °C is a 5% error in the cooling figure, and so a 5% error in kW per ton.
Optional detail: BEI appears in Malaysia's Green Building Index (GBI) rating, where a lower BEI earns points. It sits alongside MS 1525, the Malaysian Standard code of practice on energy efficiency and use of renewable energy for non-residential buildings, which covers the building envelope, lighting, air conditioning and more. Before you quote a BEI target in a report, check the current edition of the standard or scheme you are citing, because benchmarks are revised.
What comes next
You now know how to measure the cooling delivered, the electricity used and the kW per ton, and how to prove a saving. The next parts use these measurements to diagnose common faults. Part 17 starts with one that the two temperature sensors reveal, and asks: what does low delta-T look like, and why does it waste energy?
Check your understanding
- A chilled-water flow meter reads 50 L/s, the supply is 6 °C and the return is 11 °C. The plant meter reads 300 kW. What are the cooling delivered and the kW per ton? Cooling = 50 × 4.19 × 5, about 1,048 kW, which is 1,048 ÷ 3.517, about 298 RT. kW per ton = 300 ÷ 298, about 1.0 kW/RT, which is in the "average" band for a whole plant.
- Your building's BEI has not changed in two years. Does that mean the cooling plant is performing as well as ever? Not necessarily. BEI is an annual whole-building total. A plant getting less efficient could be hidden by other changes, such as fewer operating hours or lower occupancy. Only the plant's own flow, temperature and power measurements show its kW per ton.
Recap: To grade a cooling plant you need the cooling delivered and the electricity used at the same moment. Cooling delivered comes from a flow meter and supply and return temperature sensors (flow × 4.19 × delta-T). Electricity comes from power meters on the chillers, pumps and tower fans. The ratio is the real kW per ton, and it needs to be followed over time. M&V proves a saving: baseline, one change, then measure again with adjustments for weather and occupancy. BEI (annual kWh ÷ gross floor area) scores the whole building, but only the plant measurements show why the score is what it is.
Go deeper on video (optional)
This video shows how a building's chillers, cooling tower and air handling units work together. It is a useful picture of the plant whose performance you are measuring, and of where the flow, temperature and power meters described earlier would go. You do not need it for the next part.
The Engineering Mindset walks through how a building's chiller, cooling tower and air handling units work together to deliver cooling — the plant your BEI is really scoring.
This is Part 16 of 20 in Cobler's Cooling Fundamentals course. Previous: Why Chiller Efficiency Is Measured at Part Load: Understanding IPLV. Next: Low Delta-T Syndrome: The Silent Efficiency-Killer of Chilled-Water Plants.
Cobler builds CobiNeural, a platform that shows a facility team its building's energy, water and indoor air data as live numbers across the whole site. To see how your building performs, talk to us.
FAQ
Frequently asked questions
Ask us about this topic
Something in this article you want to dig into — or a situation in your own building it doesn't quite cover? Send us your question. We don't run public comments; the team replies to you directly by email.