Blog
The Time Value of Money: NPV and IRR Explained Simply
Why a ringgit next year is worth less than one today, and how NPV and IRR turn that idea into go/no-go decisions on energy-efficiency projects. Worked in full.
 Tan Kok XinEnergy Management: The Economics of Saving Energy
Part 6 of 10 in Cobler's Energy Management: The Economics of Saving Energy course. New here? See the course page.
Part 5 ended on the largest blind spot of simple payback and return on investment (ROI): they treat a ringgit saved in Year 5 exactly like a ringgit saved in Year 1. Suppose someone offers you RM1,000 today or RM1,000 in a year's time. Most people take it today. Money you hold now can be put in the bank or used in your business, so a year from now it has grown. An energy project raises the same question: you pay a lump sum now and receive smaller savings over many years. How do you compare money that arrives at different times?
This part answers that question in three steps: first discounting, then Net Present Value (NPV), then Internal Rate of Return (IRR). NPV and IRR remove that blind spot, and by the end you will be able to judge a pump retrofit the way a finance team does.
A ringgit tomorrow is worth less than a ringgit today
If you have RM1,000 today, you can deposit it, lend it or reinvest it in your business. A year from now it has grown. So RM1,000 received a year from now is worth less to you than RM1,000 in your hand today, because you lose a year of earnings on it. This is the time value of money. The yearly rate at which money is expected to grow is called the discount rate, written \(r\).
The discount rate combines three things: what you could earn elsewhere at similar risk, what it costs to borrow the money, and an allowance for uncertainty. Each company sets its own. Many companies also set a hurdle rate of about 8–12%: the minimum yearly return a project must beat to be worth funding.
This course uses a discount rate of 8% a year, nominal. It is an illustrative figure, not a rule; use your own company's rate if finance has set one.
Nominal or real? A nominal rate includes expected inflation. A real rate has inflation taken out. The two must match the cash flows. With an 8% nominal rate, each year's saving must be the ringgit you expect to actually save in that year. In this part we assume the saving stays at the same ringgit amount every year, which is the same as assuming energy prices do not change. Part 8 explains real and nominal rates in more detail.
Discounting converts future money into today's money
To compare money from different years, we convert every future amount into "today's ringgit". The tool for that is the discount factor:
$$DF = \frac{1}{(1+r)^{t}}$$
Here \(t\) is the number of years in the future and \(r\) is the discount rate. Multiply a future cash amount by its discount factor and you get its present value (PV), which is what that future money is worth in today's terms:
$$PV = \text{future cash} \times DF$$
Here is an example. Your building will save RM2,500 on electricity three years from now. At \(r = 8\%\):
$$DF = \frac{1}{(1.08)^{3}} = \frac{1}{1.2597} = 0.7938$$
$$PV = 2{,}500 \times 0.7938 = RM1{,}984.50$$
So a RM2,500 saving in Year 3 is worth about RM1,985 today. The further in the future the money arrives, and the higher the discount rate, the smaller its present value. NPV is built on this.
NPV adds up the present values and subtracts the cost
NPV takes the present value of every future cash flow, adds them together, and subtracts what you paid up front. That up-front payment is the capital expenditure, or Capex:
$$NPV = \sum_{t=1}^{n} \frac{CF_{t}}{(1+r)^{t}} - \text{Capex}$$
Here \(CF_t\) is the cash flow (the net saving) in year \(t\), \(n\) is the number of years, and the \(\sum\) sign means "add up the discounted cash flows for years 1 to \(n\)". The decision rule is:
- NPV > 0: the project earns more than your discount rate requires. It adds value, so do it.
- NPV = 0: it exactly meets your required return. You are no better or worse off.
- NPV < 0: it loses value at that rate. Do not do it.
NPV answers the question a business cares about most: how much better off does this project make us, in today's money? That is why many finance teams treat NPV as the main measure for a project.
Worked example: an energy-efficient pump
An old pump uses too much electricity. A high-efficiency replacement costs RM6,000 installed and cuts your power bill by RM2,500 every year for its 5-year economic life. Your finance team uses an 8% nominal discount rate. Is it worth it?
Discount each year's RM2,500 saving back to today:
Year (t) | Cash flow | Discount factor at 8% | Present value |
|---|---|---|---|
1 | RM2,500 | 0.9259 | RM2,314.75 |
2 | RM2,500 | 0.8573 | RM2,143.25 |
3 | RM2,500 | 0.7938 | RM1,984.50 |
4 | RM2,500 | 0.7350 | RM1,837.50 |
5 | RM2,500 | 0.6806 | RM1,701.50 |
|
| Σ PV | RM9,981.50 |
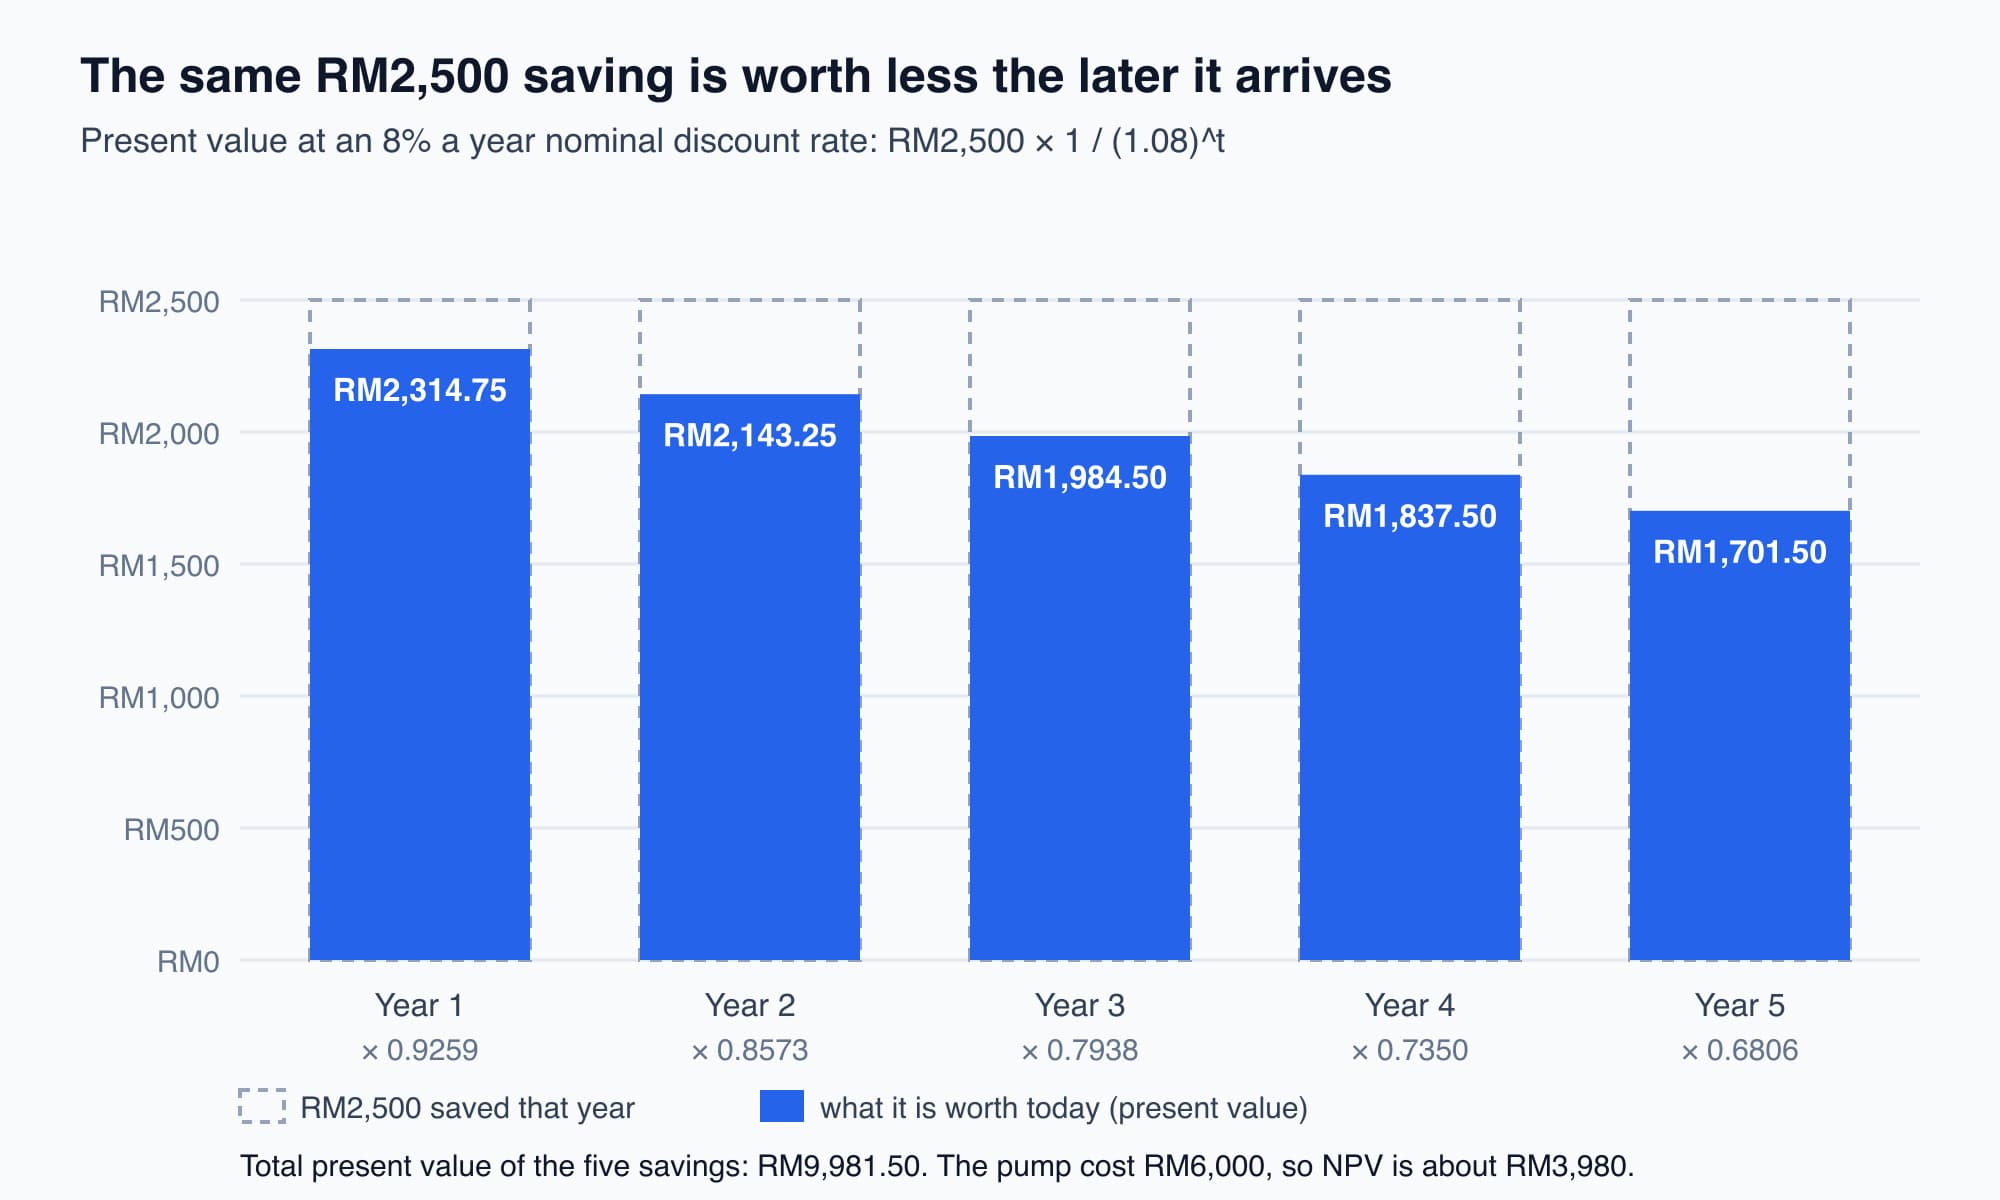
Each year's RM2,500 is worth a little less in today's money than the year before; the blue bars add up to RM9,981.50.
Now subtract the Capex:
$$NPV = 9{,}981.50 - 6{,}000 = RM3{,}981.50$$
The project adds about RM3,980 of value in today's ringgit. The NPV is positive, so the project goes ahead.
A shortcut for equal yearly savings. When the saving is the same every year (called an annuity), you do not need the full table. Multiply the yearly saving by the annuity factor for that rate and number of years. The annuity factor is the sum of the discount factors. For 8% over 5 years it is 3.9927 (the rounded factors in the table add up to 3.9926):
$$2{,}500 \times 3.9927 = RM9{,}981.75$$
That matches the table to within 25 sen of rounding. With an annuity-factor table, most simple retrofits take a few seconds to check.
IRR is the discount rate at which NPV becomes zero
NPV needs you to choose a discount rate. IRR turns the question around: what discount rate would make this project's NPV exactly zero? That rate is the project's own return: the yearly percentage at which the future savings exactly repay the Capex.
Formally, IRR is the value of \(r\) that solves:
$$\sum_{t=1}^{n} \frac{CF_{t}}{(1+r)^{t}} - \text{Capex} = 0$$
The decision rule: accept the project if its IRR is greater than your hurdle rate (typically 8–12%). A 25% IRR against a 10% hurdle is a strong yes.
There is no simple algebra that gives IRR directly. You find it by trial and error: try a rate, work out the NPV, adjust the rate, and repeat. First you find two rates that give NPVs of opposite sign (called bracketing). Then you estimate the point in between where NPV is zero (called interpolating). Spreadsheets do this with the IRR function, but it helps to see it done once by hand.
Worked example: the IRR of our pump
Same pump: Capex RM6,000, savings RM2,500 a year, 5 years. Because the savings are equal each year, the IRR is the rate at which the annuity factor equals \(6{,}000 \div 2{,}500 = 2.40\). Now bracket it.
Try 30%. The 5-year annuity factor at 30% is 2.4356.
$$NPV = 2{,}500 \times 2.4356 - 6{,}000 = 6{,}089 - 6{,}000 = +RM89$$
The NPV is still slightly positive, so the IRR is a little higher than 30%.
Try 32%. The annuity factor at 32% is 2.3452.
$$NPV = 2{,}500 \times 2.3452 - 6{,}000 = 5{,}863 - 6{,}000 = -RM137$$
Now the NPV is negative. So the IRR lies between 30% and 32%. To interpolate, assume NPV changes in a straight line between the two rates. The NPV has to fall by 89 out of the total drop of 89 + 137 = 226:
$$IRR \approx 30\% + 2\% \times \frac{89}{89 + 137} = 30\% + 2\% \times 0.394 \approx 30.8\%$$
The pump's internal rate of return is about 31%, roughly three times a 10% hurdle rate. That makes it an excellent project. Simple retrofits with short lives and large yearly savings often have high IRRs like this.
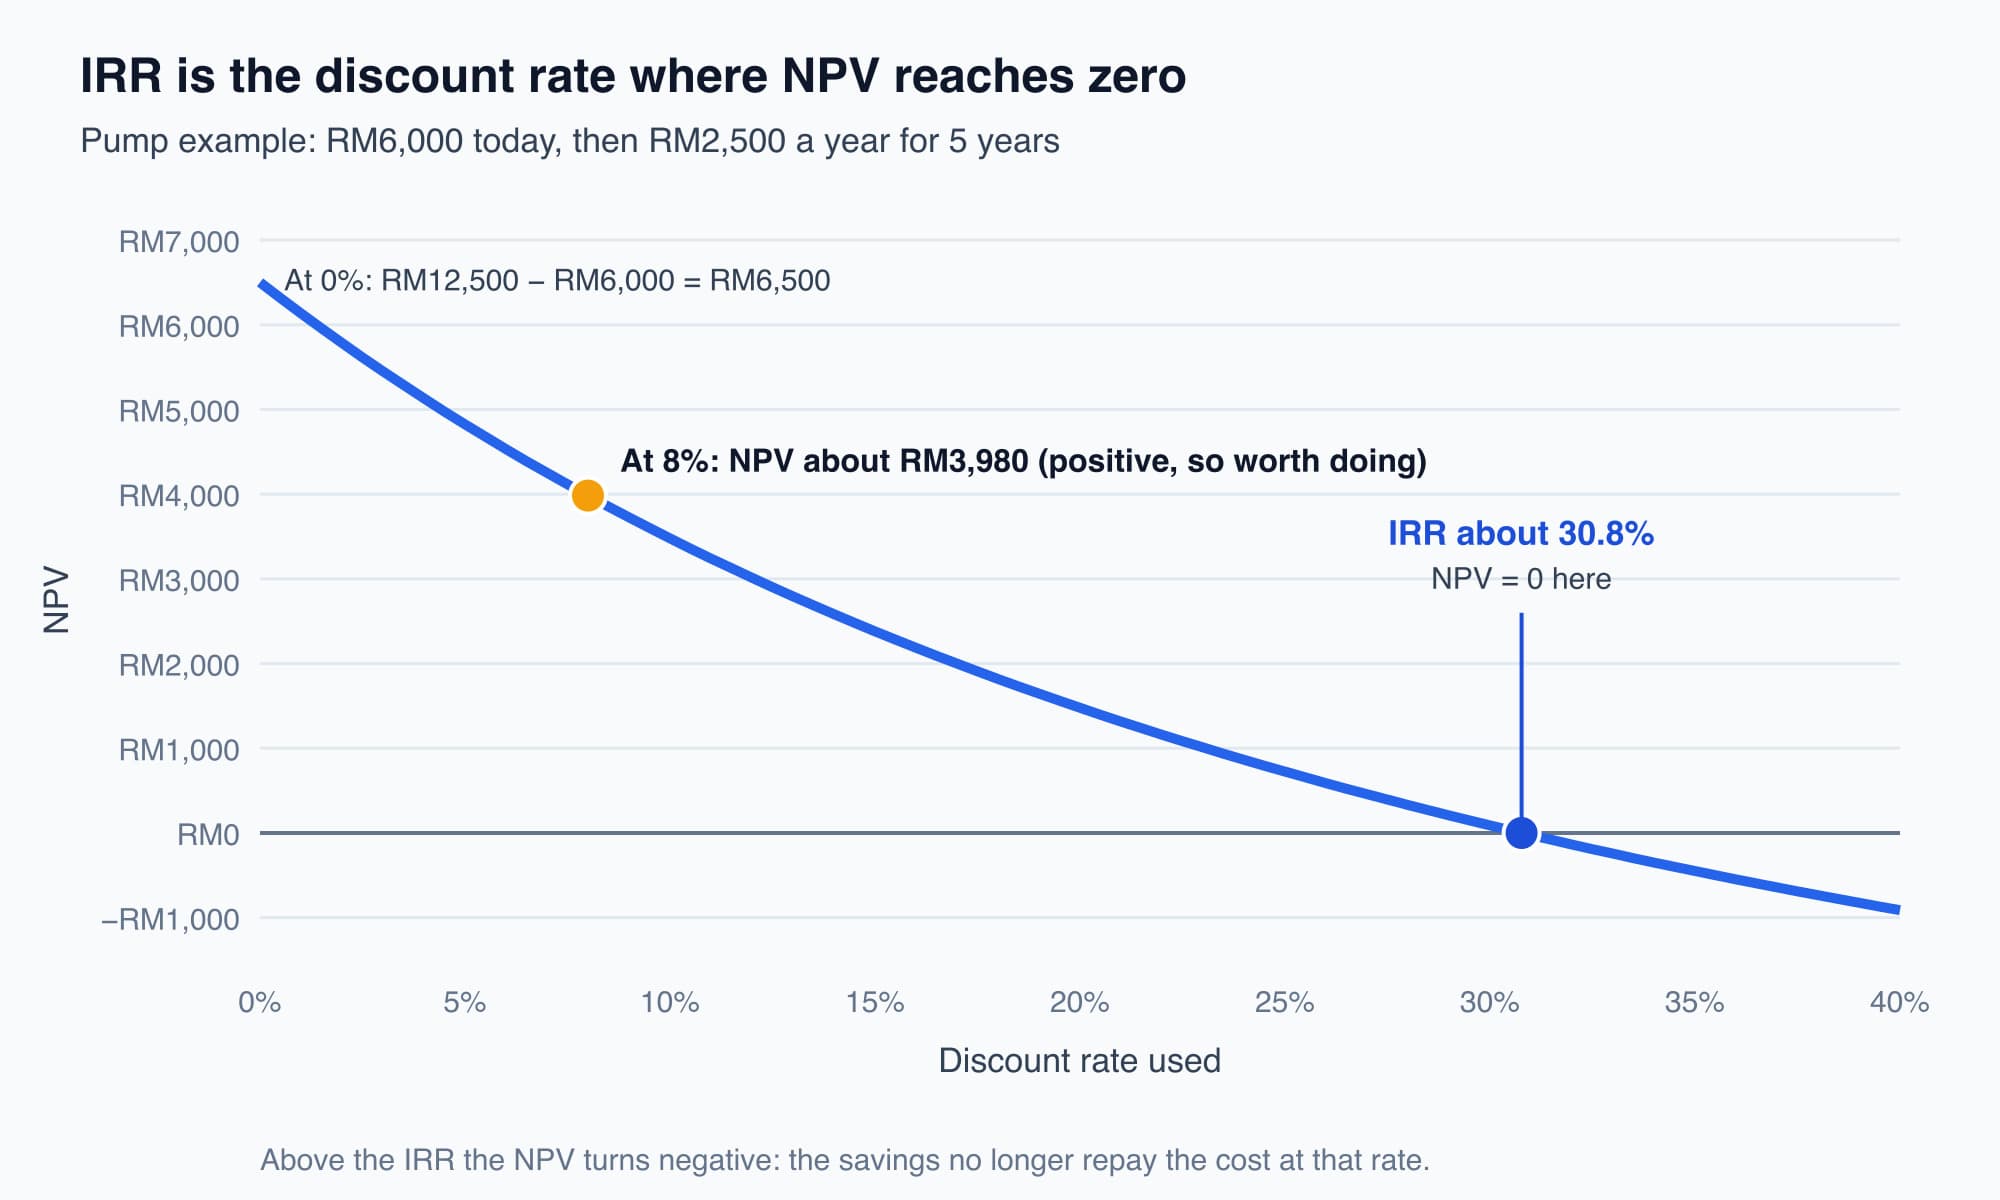
The same pump at every discount rate: NPV falls as the rate rises and crosses zero at the IRR, about 30.8%.
(If both of your trial rates give NPVs with the same sign, you have not bracketed the answer yet. Widen the gap until one NPV is positive and one is negative, then interpolate between them.)
Four IRR traps, and why NPV decides
IRR is popular because a single percentage seems easy to compare across projects. It can mislead in four ways:
- Projects of different size. A RM5,000 gadget with a 40% IRR looks better than a RM400,000 chiller upgrade at 18%. But the chiller might add RM120,000 of NPV against the gadget's RM4,000. A percentage does not show the size of the gain.
- Projects of different life. A 2-year quick win and a 15-year deep retrofit can have the same IRR and deliver very different total value.
- A high IRR with a smaller NPV. When IRR and NPV rank two projects differently, follow NPV. NPV measures money; IRR measures a rate.
- Unusual cash flows. If a project has a large cash outflow partway through its life, such as a mid-life overhaul, the IRR equation can have more than one answer: two different rates that both make NPV zero. Neither is meaningful. In that case, do not use IRR; rank by NPV.
A good rule of thumb: use NPV to make the decision, and use IRR to tell the board how hard the money is working. When the two disagree, NPV wins.
Choose the measure that suits the question and the audience
You have now met simple payback, ROI, NPV and IRR. You will also see three related measures in proposals and grant forms:
- Discounted payback is payback counted with discounted savings. For our pump, the discounted savings pass RM6,000 during Year 3, at about 2.8 years, against a simple payback of 2.4 years. Discounted payback is always longer than simple payback.
- Savings-to-investment ratio (SIR) is the present value of the energy savings divided by the investment. Above 1 means the project returns more than it costs.
- Benefit-cost ratio (BCR) is the present value of all benefits divided by the present value of all costs. It can include non-energy benefits such as lower maintenance, if you can support a number for each.
These measures do not compete with each other. Each answers a slightly different question for a different reader:
Metric | Best used for | Audience |
|---|---|---|
Simple payback | Fast screening, first-pass gut check | Anyone; non-financial managers |
Discounted payback | Risk and liquidity view; how long is cash tied up | Cautious owners, lenders |
NPV | The best all-round measure; ranking projects; absolute value in RM | Owners, investment committees |
IRR | Comparing return against a hurdle rate | CFOs, boards, financiers |
SIR | Efficiency of capital per ringgit of energy saved | ESCOs, government grant schemes |
BCR | Projects with real non-energy benefits | Owners weighing comfort, health, carbon |
(ESCOs are energy service companies, which fund or guarantee energy savings under contract. CFO means chief financial officer.)
Read the table as an order of work. Screen a long list of ideas with simple payback to remove the clear non-starters. Rank the rest by NPV, because NPV accounts for both timing and size. Present the chosen project as an IRR to the finance director, because finance teams compare returns against a hurdle rate. Use SIR on a grant form and BCR when part of the value is not on the electricity bill. The optional side reading SIR, BCR and Discounted Payback works through these three in full; you do not need it for the rest of the course.
Every one of these numbers is only as good as the yearly saving you feed into it. If the project reduces maximum demand, the Cobler maximum-demand calculator helps size the yearly RM saving that becomes your \(CF_t\). The difference between power and energy that sets those savings is explained in kW vs kWh explained. Measured before-and-after data, from meters like those described in how electricity meters work, turns an estimated cash flow into one you can check, as set out in the Part 4 M&V (measurement and verification) plan.
What comes next: the full cost of owning equipment
So far we have discounted savings. The same method can also add up every cost of owning a piece of equipment over its life: the price, the energy, the maintenance and the replacement parts. The next part, Life-Cycle Costing: The Cheapest to Buy Is Often the Costliest to Own, uses it to compare a cheap motor with an efficient one.
Check your understanding
- At an 8% nominal discount rate, what is RM10,000 received in two years' time worth today? The discount factor for 2 years at 8% is 1 ÷ (1.08)², which is 1 ÷ 1.1664 = 0.8573. So the present value is RM10,000 × 0.8573 = RM8,573.
- Project A has an IRR of 40% and an NPV of RM4,000. Project B has an IRR of 18% and an NPV of RM120,000. You can fund only one. Which should you choose, and why? Project B. IRR is a percentage and does not show the size of the gain. NPV measures the value added in today's ringgit, and B adds far more. When NPV and IRR disagree, follow NPV.
Recap: A ringgit in the future is worth less than a ringgit today. The discount factor \(1/(1+r)^t\) converts a future amount to its present value; this course uses 8% a year, nominal, with nominal cash flows. NPV adds up the present values of all the savings and subtracts the Capex; a positive NPV means the project adds value. IRR is the discount rate at which NPV is zero, found by bracketing and interpolating; accept when it beats the hurdle rate. When the two disagree, follow NPV. Screen with payback, rank with NPV and present with IRR.
This is Part 6 of 10 in Cobler's Energy Management: The Economics of Saving Energy course. Previous: Simple Payback and ROI: The Quick Screening Tools. Next: Life-Cycle Costing: The Cheapest to Buy Is Often the Costliest to Own.
Cobler builds CobiNeural, a platform that shows a facility team its building's energy, water and indoor air data as live numbers across the whole site. To see how your building performs, talk to us.
FAQ
Frequently asked questions
Ask us about this topic
Something in this article you want to dig into — or a situation in your own building it doesn't quite cover? Send us your question. We don't run public comments; the team replies to you directly by email.