Blog
Fault Detection and Diagnostics
How a building turns thousands of readings a minute into a short list of faults: baselines, if-then rules built on physics, anomaly models that learn normal, and what AI can and can't do. Worked: low delta-T, a pump at 2 a.m. and a maximum demand alert.
 Tan Kok XinElectricity Fundamentals
Part 22 of 23 in Cobler's Electricity Fundamentals course. New here? Start with the course map.
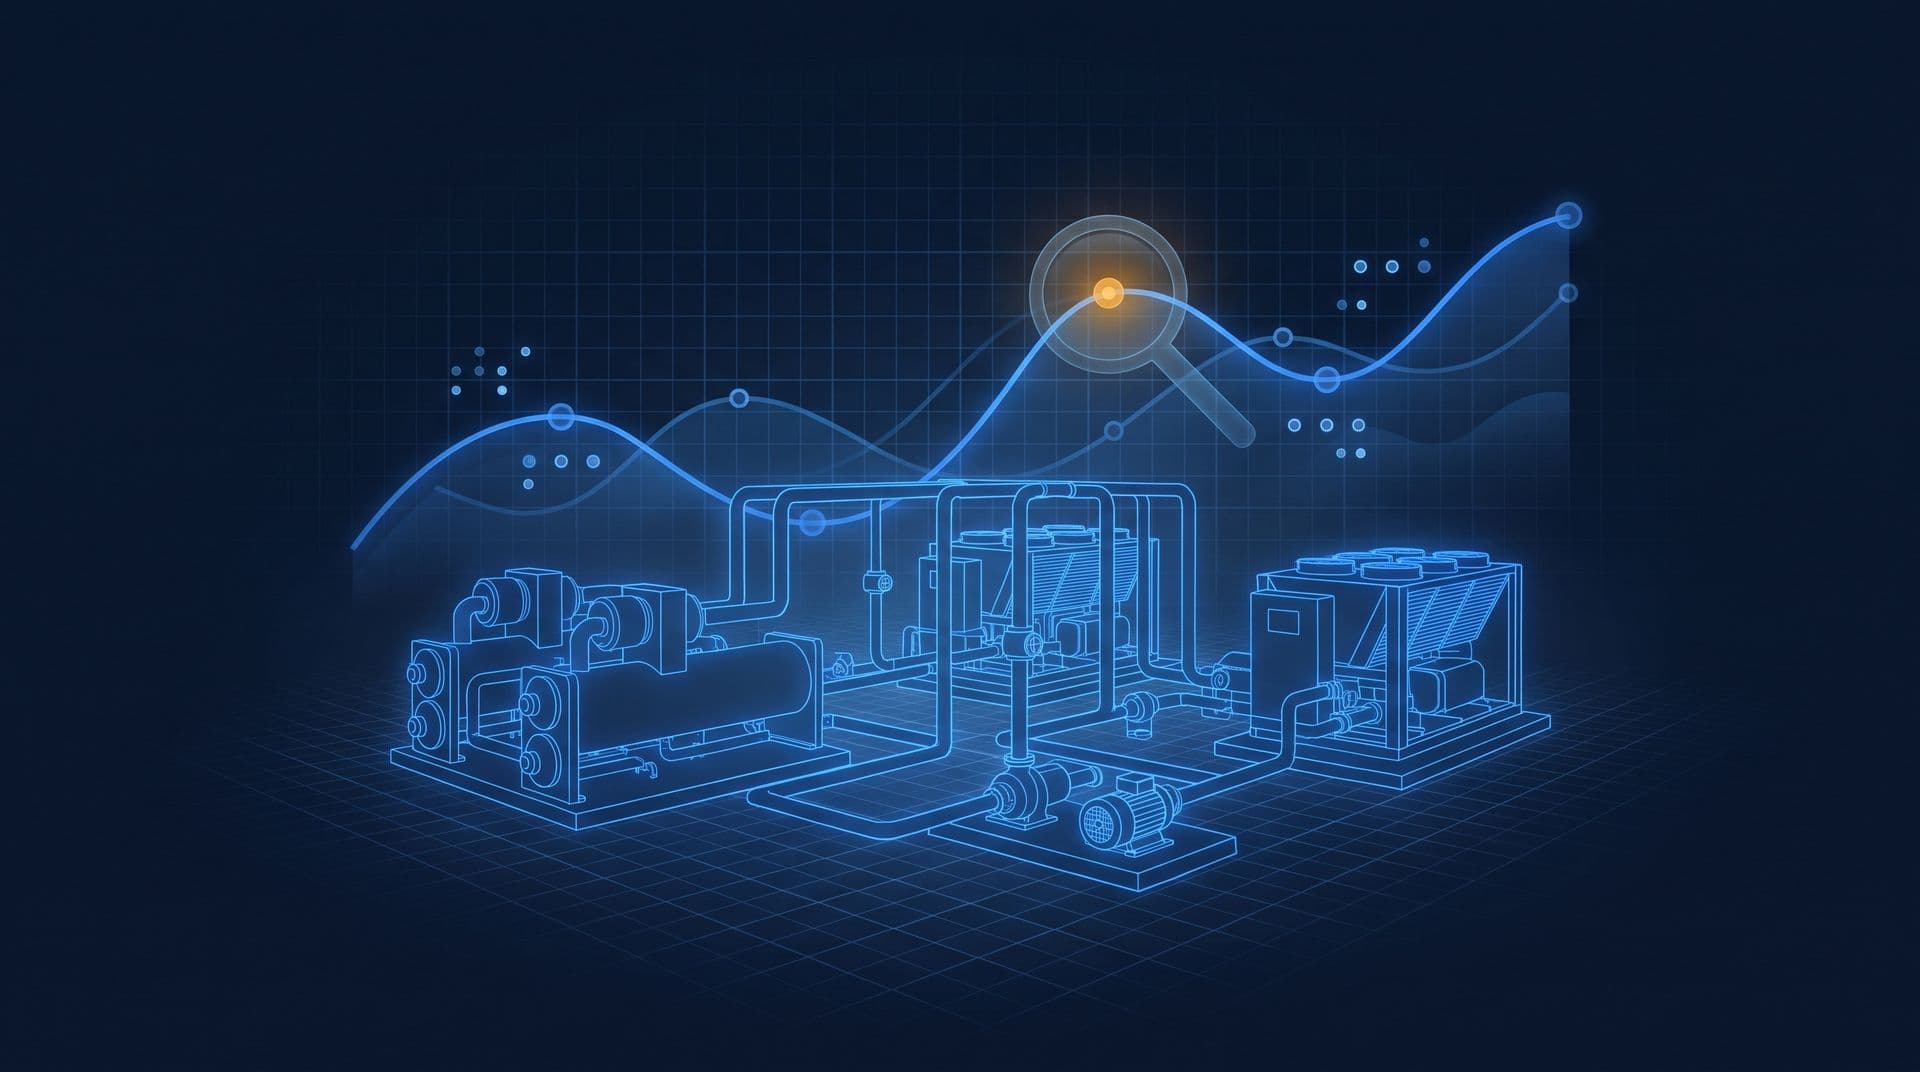
So in Part 21 we put thirty meters on one RS-485 chain, and now about 17,000 readings a minute arrive in one place, before we even count the building management system (BMS). But no person can watch all of that. If you read one a second, nonstop, one minute's worth would take you nearly five hours. So which reading matters right now? That's the question a facility team is left with once the meters and sensors are connected, and answering it is the job of fault detection and diagnostics (FDD), the software that reads the stream for us.
Somewhere in that stream, a pump might be running when it shouldn't be, or a valve might be stuck, or the month's maximum demand might be about to be set. In this part we'll build FDD in three layers, each one starting where the last one runs out, and we'll end on a chiller plant's Monday morning list.
Fault detection and diagnostics
So FDD is really two jobs. Detection notices that something isn't behaving the way it should, whether that's a valve, a pump or a whole plant. Diagnostics names the likely cause, so a technician knows where to go. And it runs all the time, on the trends the building already logs.
Every FDD method rests on one idea, which is expected versus actual. Think about a thermometer. A reading of 38.5 °C only means fever because we know a healthy body sits near 37 °C. In a building, the readings are the actual, and the methods only differ in where the "expected" comes from.
Trends and baselines
The simplest expected value is the building's own past. A trend is one reading logged at fixed intervals, like a pump's kW every minute. A baseline is the normal pattern we build from those trends, so what the pump draws on a hot weekday afternoon, and what it draws on a Sunday at 3 a.m. (ideally nothing). Before you claim savings: baseline and load profile shows how to build one. Trends already show a lot when someone looks at them, like a step change, or a flat line from a dead sensor, or a load that never switches off. The catch is that someone has to look.
And it's worth automating. In a US Department of Energy campaign analysed by Lawrence Berkeley National Laboratory, covering 104 organisations and about 6,500 buildings, the ones using FDD saw median energy savings of 9% (LBNL, Proving the Business Case for Building Analytics). Results vary by site, and to be honest the savings only arrive when someone acts on what the software finds.
So how do we go from a person looking to software that looks for us? Well, what if we write down what an engineer would check, and let the computer check it every minute?
Rules
Let's take a cooling coil in an air handling unit (AHU). When the chilled-water valve is wide open, the coil is getting all the cold water it can, so the air leaving it should be cold. Written for a computer, that looks something like this (illustrative thresholds):
IF the fan is running (a digital input) AND the chilled-water valve command is above 95% (an analog output) AND the supply air is more than 2 °C above setpoint (an analog input), all for 30 minutes, THEN flag "coil not delivering cooling".
So that's an engineer's physics, written down to flag a named fault when its conditions hold long enough, and we call that a rule. Let's walk through the cases:
- Fan off: no flag, since no air is moving.
- Valve at 95% or less: no flag, because it can still open further.
- Supply air no more than 2 °C above setpoint: no flag, because the coil is coping.
- All three true for under 30 minutes: no flag yet. After a morning start the valve often sits wide open while the coil catches up, so an instant rule would cry wolf.
- All three true for 30 minutes: flag.
If that looks familiar, it's the AND logic of relay contacts in series from Part 6, now running in software on the points from Part 20. The diagnosis lists the usual causes, which are chilled water arriving too warm, a fouled coil, a stuck valve or too much airflow.
Low delta-T
Rules work at plant level too. A chilled-water plant delivers cooling equal to the water flow times its temperature rise:
$$Q \ (\text{kW}) = \dot{V} \ (\text{L/s}) \times 4.19 \times \Delta T \ (^\circ\text{C})$$
Here 4.19 is the energy, in kJ, that it takes to warm one litre of water by 1 °C. So to deliver 1,000 kW of cooling at a design ΔT of 5.5 °C, the pumps have to move 1,000 ÷ (4.19 × 5.5) ≈ 43 L/s. Now say the return water comes back only 3.0 °C warmer. The same cooling then needs 1,000 ÷ (4.19 × 3.0) ≈ 80 L/s. That's 83% more water, which means more pumps running and often an extra chiller. This is what we call low delta-T syndrome, and a rule catches it: IF plant ΔT stays under 4 °C for an hour while the load is above 40%, THEN flag low delta-T (illustrative thresholds).
So rules are clear, and anyone can read why one fired. But someone has to write each one, and they only find the faults that someone thought of.
Anomaly detection
So what about the faults nobody thought of? Well, what if we let the data tell us what normal looks like?
Let's take a simple model for a chiller plant that learns how its power rises with outdoor temperature on occupied weekdays. Say three months of data give us this line (illustrative):
$$P_{expected} = 150 + 18 \times (T_{out} - 24)$$
At 33 °C outside, the plant should draw 150 + 18 × 9 = 312 kW. But it's actually drawing 365 kW, which is 53 kW, or 17%, more than expected. On its own, 365 kW looks unremarkable, and no fixed alarm limit would fire. But if this plant's readings normally scatter about 15 kW either side of the line, then 53 kW is about three and a half times the normal scatter, and that gets flagged.
Now, my first instinct was something simpler, just a lower fixed limit of, say, 340 kW. But a healthy plant reaches 340 kW at about 34.6 °C outside, so the alarm would fire every very hot afternoon and still miss a 17% fault on a mild 28 °C day. So the expected value has to move with the weather.
What we've just done is learn the expected value from history and flag readings that land too far from it, and that's what we call statistical anomaly detection. Nobody has to write the fault in advance, so the same method catches things nobody wrote a rule for, like a load running out of schedule, or a slow drift as condenser tubes foul. What energy anomaly detection actually does goes further.
We can put the three layers side by side:
Layer | Where "expected" comes from | Good at | Misses |
|---|---|---|---|
Trends and baselines | The building's own history | Step changes, dead sensors, loads left on | Anything nobody looks at |
Rules | Physics an engineer writes down | Named faults with a clear cause | Faults nobody thought of |
Anomaly models | Patterns learned from the data | Drift, schedule faults, the unexpected | The cause, without a rule or a person |
Machine learning and AI
Machine learning is basically the same expected-versus-actual idea with a lot more inputs, like weather, humidity, occupancy, day type and the state of every other machine. The software finds the relationships itself, for hundreds of meters at once. Large language models (LLMs) then add a plain-language layer on top. They can answer "what set last month's peak?" and explain a flagged fault, as long as they answer from the real readings and don't guess (LLMs in building automation).
But we also need to be clear about what they can't do:
- They don't run the safety layer. Interlocks, trips and protection stay in hard logic, the relays of Part 6 and the breakers and residual current devices (RCDs) of Part 14. So the software can advise, and the protecting is left to the hardware.
- They can't see what isn't measured. If there's no current transformer on a feeder (Part 19), there's no answer about that feeder.
- They can't fix bad data. A broken 4-20 mA wire (Part 20), a swapped register order (Part 21) or a CT on the wrong phase all look like faults. So FDD has to rule these out before it blames the equipment, and a fault that turns out to be a bad sensor is still worth fixing.
Alarm floods
Where FDD really earns its place is in turning a flood of alarms into a short list, ranked by what each fault costs.
A conventional BMS raises an alarm for every point that crosses a limit. So one tripped chiller can set off dozens of them, for its flow, its temperatures and every AHU downstream that loses cooling. Process plants have measured this for years. The ISA-18.2 alarm management standard aims for about one alarm per operator every 10 minutes, and it treats any 10-minute period with more than 10 alarms for one operator as a sign of an alarm flood (ISA-18.2 performance metrics). Operators who live with floods learn to acknowledge without reading, and that's how buildings drift into alarm fatigue.
So FDD groups related symptoms under one fault and ranks faults by cost per day, comfort risk and equipment risk. What we end up with is a list a team can work through, with each fault's evidence, its likely cause and the cost of waiting. Someone still has to own it, though. The chief engineer assigns each item, a technician fixes it, and the trend afterwards proves the fix held.
A chiller plant's Monday list
Let's take an office tower's Monday list (illustrative). Everything on it comes from the readings that Parts 19 to 21 collect.
1. A rule catches low delta-T. On Saturday afternoon, plant ΔT sat at 3.1 °C for four hours, with two chillers running to carry the load of one. The diagnosis points to the AHUs. One coil's valve is stuck 100% open even though its supply air is already below setpoint, so cold water is rushing through that coil without picking up much heat.
2. An anomaly catches a pump at 2 a.m. Condenser water pump CWP-2 drew 27 kW from 2 a.m. to 6 a.m. on Sunday, while every chiller was off. The model expected about zero. That's 27 kW × 4 h = 108 kWh in one night, and it would have repeated every night until someone noticed.
3. A maximum demand alert fires mid-interval. TNB bills a medium voltage customer for the month's highest 30-minute average demand (Part 5). On a hot Thursday the site's target is 1,600 kW. Twenty minutes into the 2:00 to 2:30 p.m. interval, the average so far is 1,650 kW. So to finish the half hour at 1,600 kW, the last 10 minutes have to average:
$$\frac{1600 \times 30 - 1650 \times 20}{10} = \frac{48{,}000 - 33{,}000}{10} = 1500 \ \text{kW}$$
So the alert asks the operator to shed 150 kW for 10 minutes, for example by holding back the next chiller stage. If that works, the month's peak stays at 1,600 kW. If it doesn't, the peak becomes 1,650 kW, and on a time-of-use (ToU) tariff at RM97.06 per kW those 50 kW add about RM4,853 to the month's bill (why one bad half-hour costs so much).
Reading the whole building
So now every piece is built. We've done electrons, push and flow (Parts 1 to 5), magnetism and machines (Parts 6 to 11), electricity at scale (Parts 12 to 17), and then inside the building, distribution, measurement, sensors, communication and now decisions (Parts 18 to 22). The last step doesn't add a new piece. What's left is to read one building end to end, from its 11 kV intake to a ranked fault list, using all of them. So what does that look like for one real tower? That's the capstone, Part 23: Read a Building's Electrical Story.
This is Part 22 of 23 in Cobler's Electricity Fundamentals course. Previous: Modbus RTU and RS-485. Next: Capstone: Reading a Building's Electricity.
Cobler builds CobiNeural, which runs anomaly detection and maximum demand alerts on a building's live data and sends them to the right person by WhatsApp or email. To see what it would flag on your site, request a demo.
FAQ
Frequently asked questions
Ask us about this topic
Something in this article you want to dig into — or a situation in your own building it doesn't quite cover? Send us your question. We don't run public comments; the team replies to you directly by email.