Blog
How to Read a Single Line Diagram
The boxes-and-one-line drawing on the electrical room wall is a single line diagram. Here is the one trick it is built on, and how to read it top to bottom.
 Tan Kok XinBuilding Electrical Fundamentals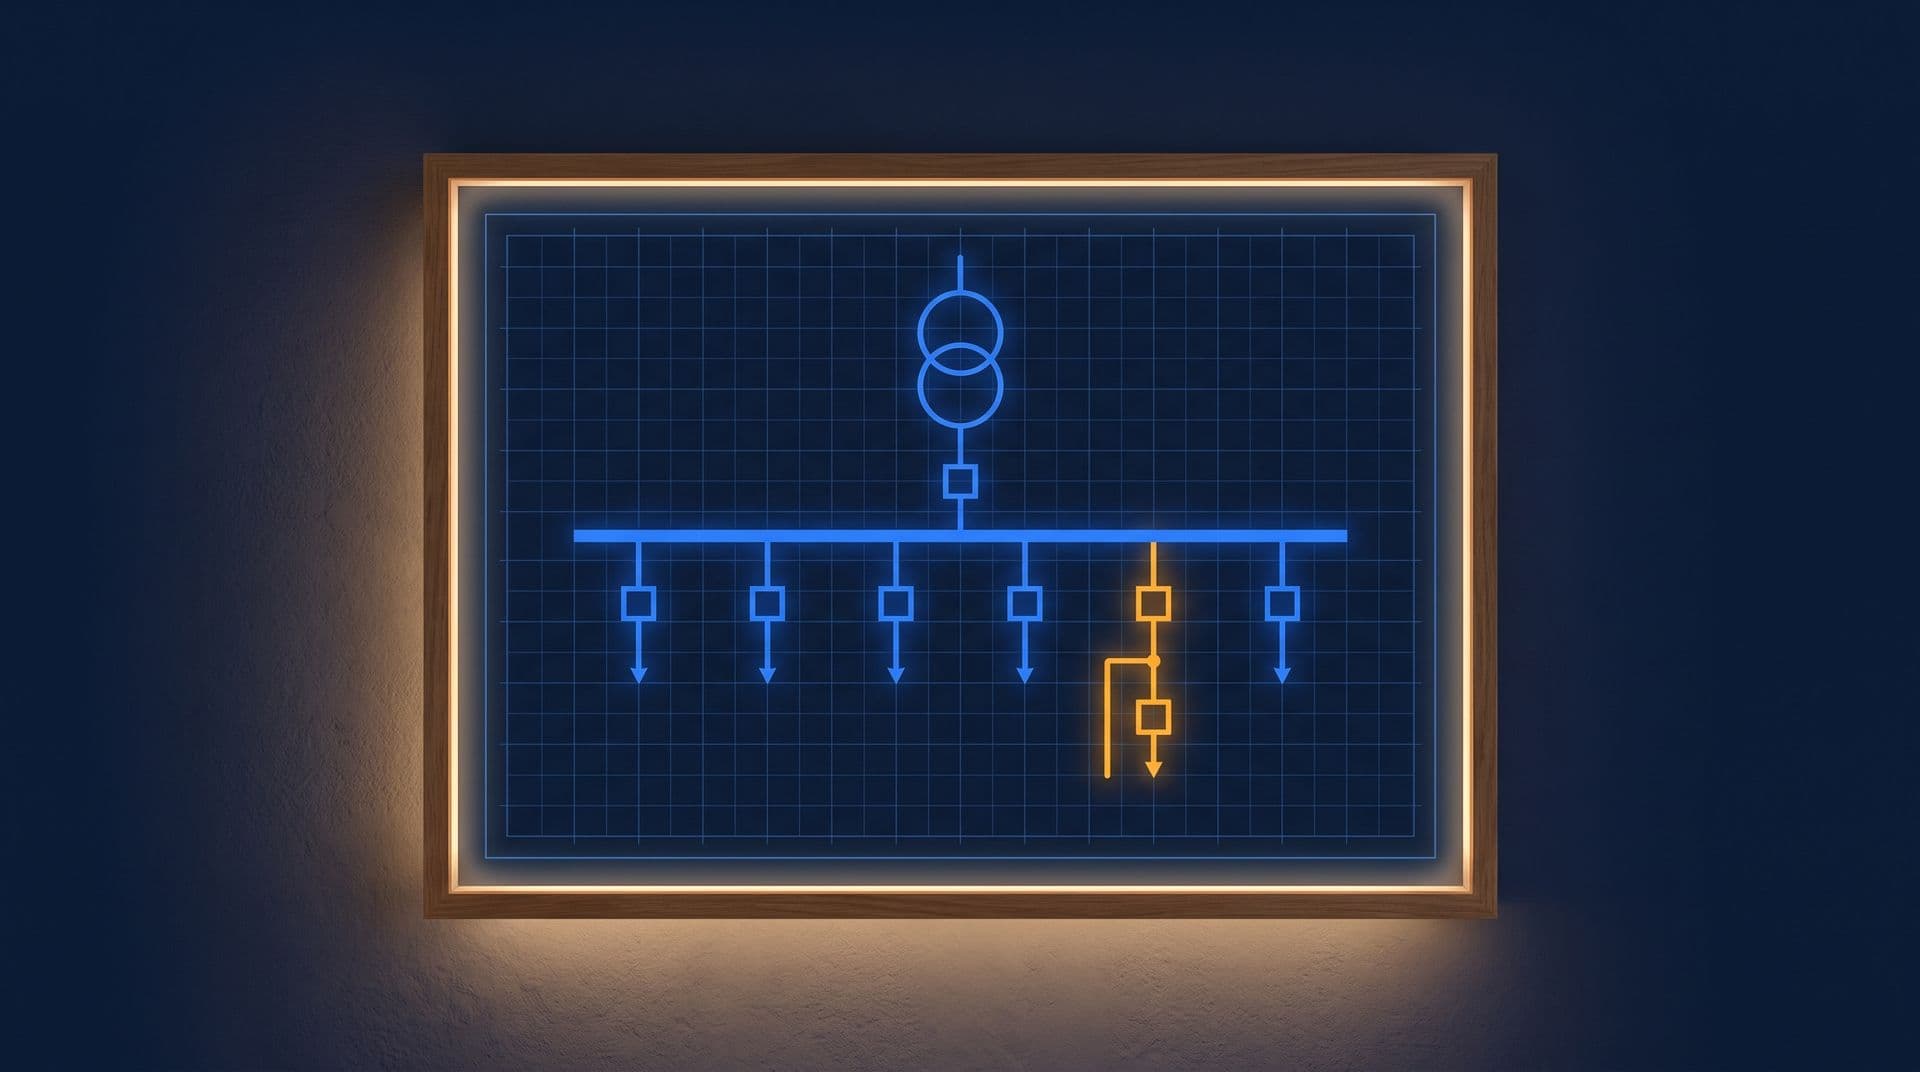
Part 3 of 11 in Cobler's Building Electrical Fundamentals course. New here? See the course page.
Parts 1 and 2 followed the office tower's power from TNB's ring, through the substation, and down the tree of boards to a single socket. All of that is drawn on one sheet, the single line diagram. What is a single line diagram, and how do you read it?
On the wall of most electrical rooms there is a laminated copy, often a little yellowed, made of boxes, circles and one long connected line. The same drawing appears near the front of most consultants' electrical reports. This part teaches you to read one, using the drawing of the office tower. The same drawing comes back in later parts, so it is worth learning well. It also relies on Three-Phase Power Explained from Cobler's Electricity Fundamentals course.
What is a single line diagram?
A single line diagram is the building's whole electrical system drawn on one page, from the TNB (Tenaga Nasional Berhad) supply at the top down to the boards that feed each floor and each piece of plant.
The name describes how it is drawn. A building runs on three-phase power, so almost every circuit is really three phase conductors, usually with a neutral and a protective earth as well. If the drawing showed every conductor, each route would be four or five parallel lines, and the page would be a tangle that told you nothing extra. So each three-phase circuit is drawn as one line. One line stands for the whole bundle.
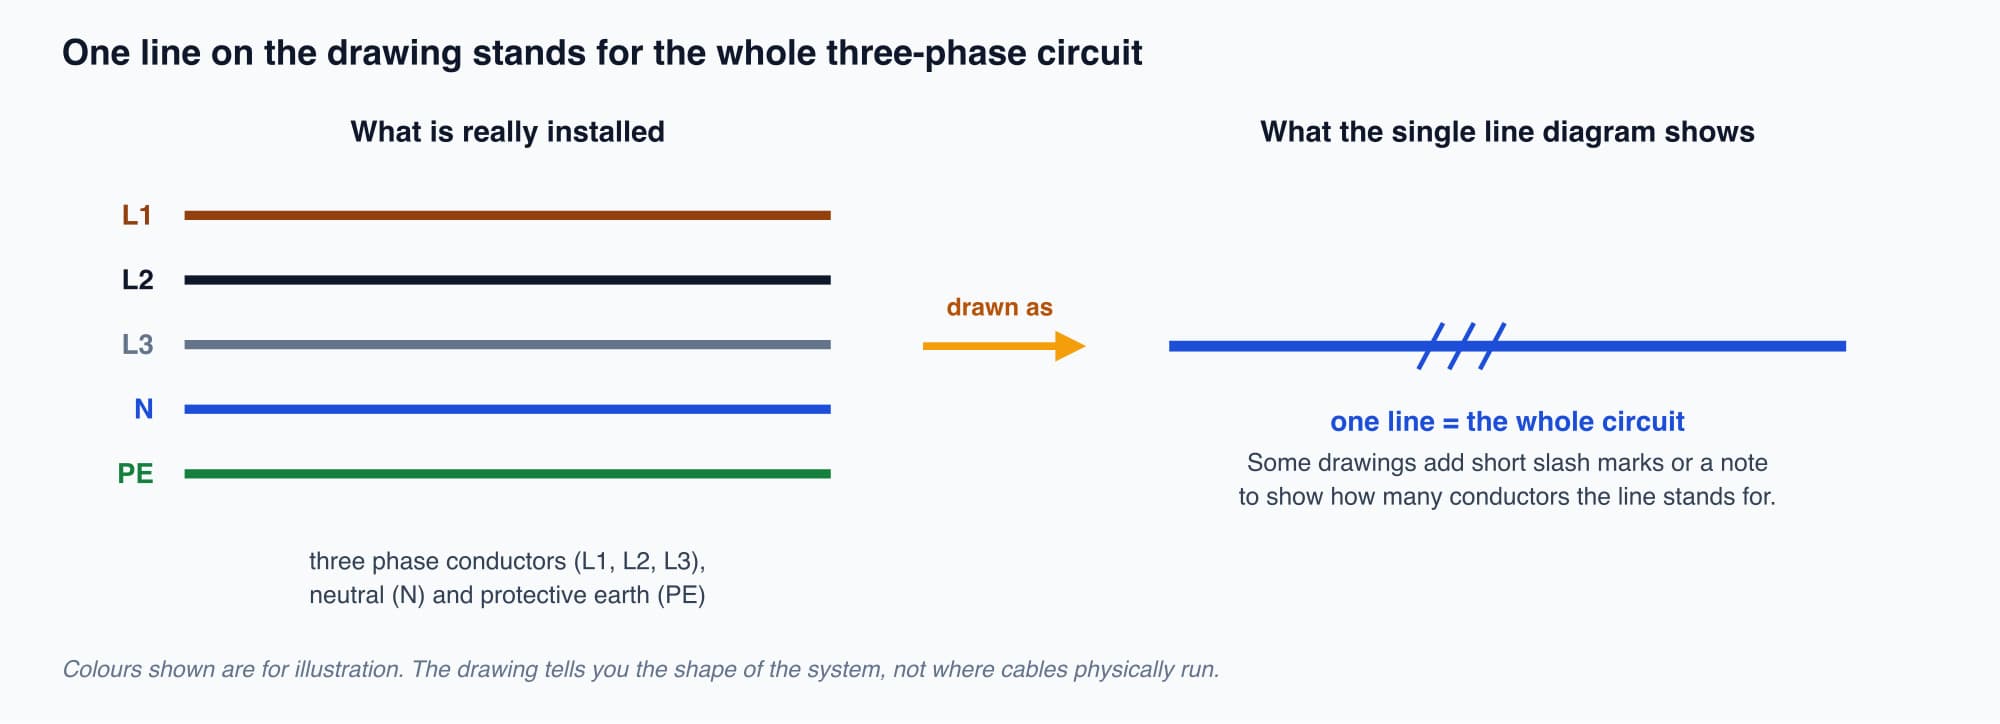
On a single line diagram, one line stands for all the conductors of a circuit, so the drawing shows the shape of the system rather than every wire.
A useful comparison is a train network map. It is not drawn to scale and it does not show where the tracks physically run. It shows every line and every station, and how to get from one to another. A single line diagram does the same for electricity: it shows how power gets from the incoming supply to any board or circuit, but not where the cables are installed. For that, you need the building's cable route drawings.
Start at the top, where the supply arrives
Read the drawing from the top down, following the direction the power flows. Here is the office tower's single line diagram. Breaker ratings are left off for now; Part 4 adds them.
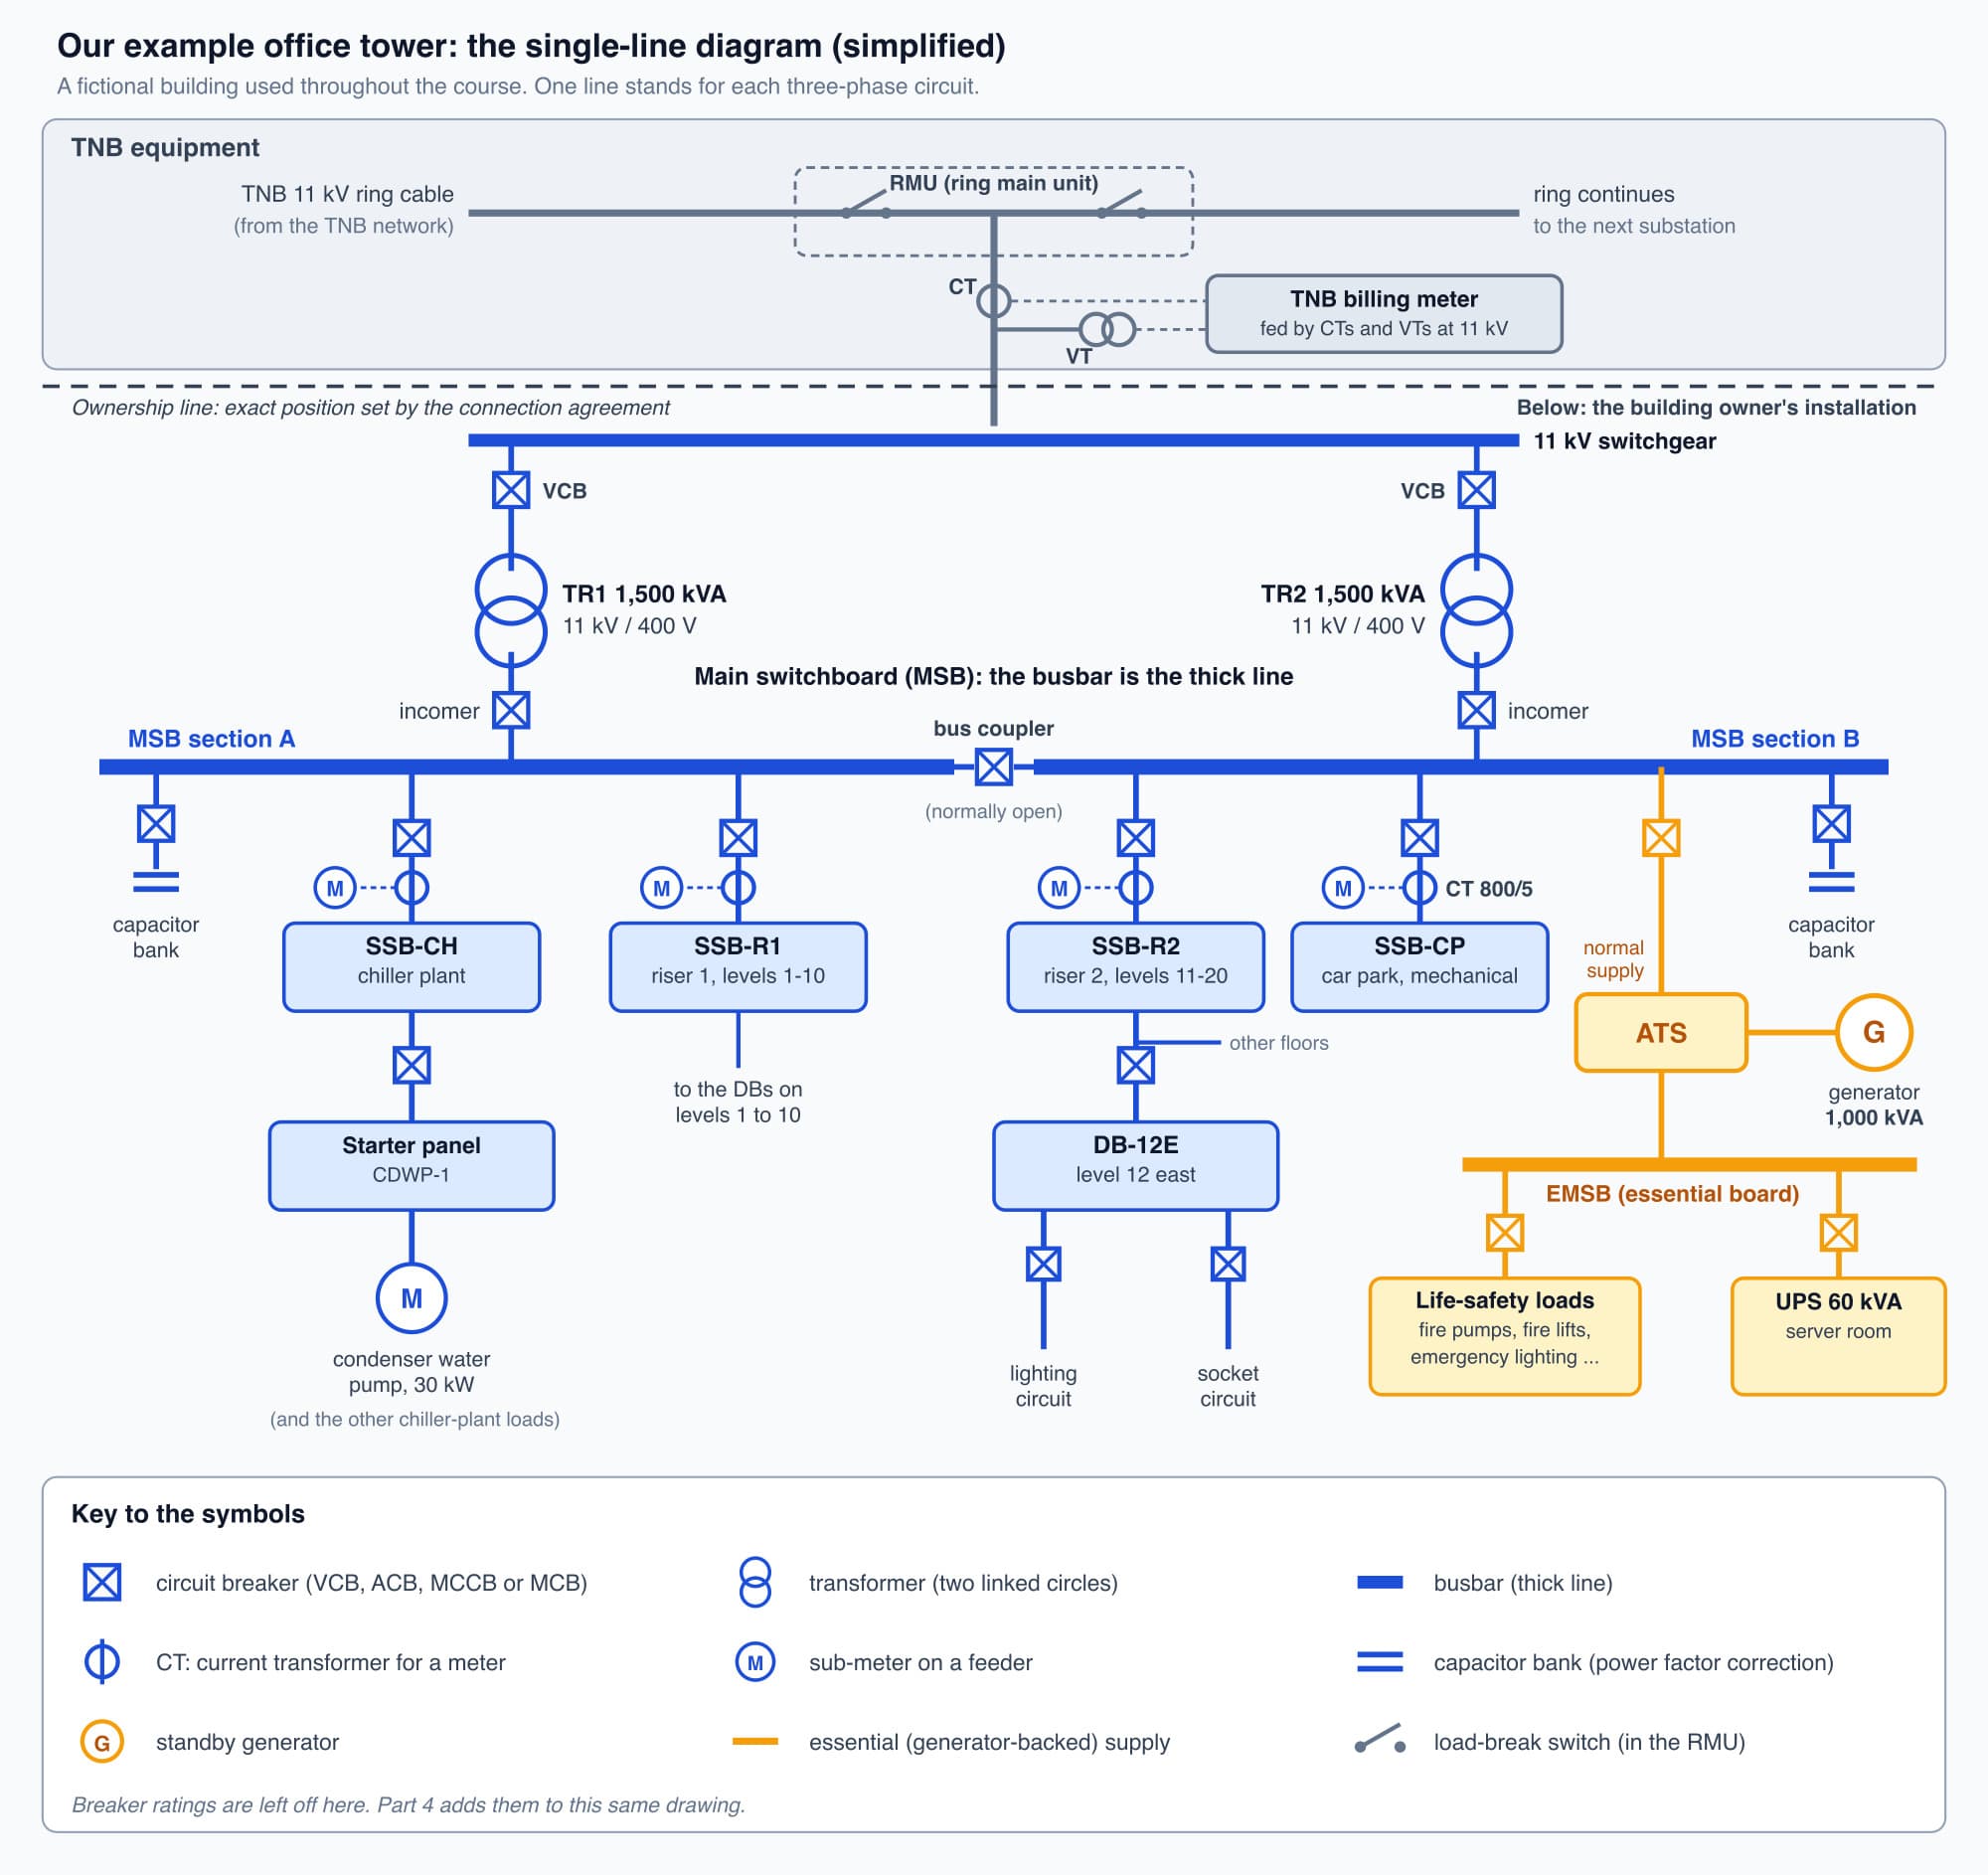
The office tower on one page: TNB's equipment at the top, the building's two transformers, the two halves of the main switchboard, the branches below them, and the essential supply in amber.
The top of the sheet is the incoming supply. In the office tower this is TNB's 11 kV ring cable, drawn as a horizontal line, passing through the ring main unit (RMU). The small angled strokes are its load-break switches. Below the RMU, a small circle on the line is a current transformer (CT) and a pair of linked circles to the side is a voltage transformer (VT). Together they feed the TNB billing meter, exactly as Part 2 described.
The dashed horizontal line is the ownership line. Everything above it is TNB's equipment; everything below it belongs to the building owner. On a real drawing its position follows the connection agreement.
The transformer symbol and its label
Below the ownership line is the building's 11 kV switchgear, drawn as a thick horizontal line with a breaker (the VCB, vacuum circuit breaker) dropping down to each transformer.
A transformer is drawn as two linked circles, one for each winding. Beside each one is its label: TR1, 1,500 kVA, 11 kV / 400 V. The label tells you three things:
- which transformer it is (TR1 or TR2),
- its size in kilovolt-amperes (kVA), which Part 2 explained,
- the voltage it takes in and the voltage it gives out. It takes in 11,000 V and hands the building 400 V between phases, which is 230 V from each phase to neutral. How Transformers Work explains the physics behind the symbol.
Worth knowing: You may see 11 kV / 433 V on older drawings or on a transformer's nameplate. The 433 V is a rating given by the transformer maker for its output side. The building's supply is still described as nominal 400/230 V, and that is the figure to use in calculations.
The busbar is the trunk, and each line dropping from it is a feeder
Below each transformer is a breaker labelled incomer, and below that a thick horizontal line. That thick line is the busbar of the main switchboard (MSB): a set of heavy copper bars that every outgoing circuit connects to. It is the trunk of the tree from Part 1. It is easy to mistake for a wire like the others. It is really the common connection that all the outgoing circuits share.
In the office tower, the MSB busbar is in two halves. Section A is fed from TR1 and section B from TR2. Between them is a bus coupler, a breaker that is normally open, so each transformer feeds its own half. Closing it lets one transformer feed both halves, for example while the other is being maintained. At the tower's maximum demand, about 1,739 kVA, one 1,500 kVA transformer could not carry the whole building, so this switching is planned in advance by the competent person.
Now read downwards. Every vertical line dropping from the busbar is one feeder: one outgoing circuit to one destination. Read each drop the same way:
- The breaker at the top of the drop (a square with a cross on our drawing).
- Anything on the line below it, such as a CT and sub-meter.
- The board it feeds at the bottom.
Do that for each drop and you have read the main switchboard. From section A, feeders go to SSB-CH (chiller plant) and SSB-R1 (riser 1, levels 1 to 10). From section B, they go to SSB-R2 (riser 2, levels 11 to 20), SSB-CP (car park and mechanical) and the normal supply for the essential board. Below SSB-R2 you can follow one more step down to DB-12E, the level 12 east distribution board, and its lighting and socket circuits. Below SSB-CH you can follow the supply to the starter panel of the condenser water pump CDWP-1.
Beside each breaker on a real drawing you will see labels such as 630 A. These are the breaker's ratings. Circuit Breaker Types, the next part, explains what they mean and adds them to this same drawing.
The other symbols on the drawing
A few more symbols appear on most building SLDs. Each is explained here only far enough to recognise it.
- A CT and "M" on a feeder: a sub-meter. Look at the feeder to SSB-CP. The small circle on the line is a CT, marked 800/5. This means that 800 A flowing in the feeder produces 5 A in the CT's secondary wiring, which runs to the sub-meter (the circle marked M). The meter multiplies what it measures by 160 (800 ÷ 5) to get the real current. This is how an electricity meter measures a current far too large to pass through it. The tower has sub-meters on each SSB feeder, so the SLD tells you exactly which part of the building each sub-meter measures.
- Two short parallel plates: a capacitor bank. It corrects the building's power factor. Motors and similar equipment draw some current that does no useful work; the capacitor bank supplies that current locally, so less of it has to come through the transformers. For a supply like the tower's, TNB requires a power factor of at least 0.85 and adds a surcharge if it falls below that. The office tower typically runs at 0.92. Power Factor Correction in Cobler's electricity bill course explains it fully; you do not need the details for this course.
- A "G" in a circle: the standby generator. Follow its line to the box marked ATS, the automatic transfer switch, which feeds the EMSB, the essential switchboard from Part 1. Its normal supply comes from MSB section B. The 60 kVA UPS hangs off the EMSB. When the Mains Fails, Part 8 of this course, explains how these work during a power cut.
Drawings from different consultants vary a little, so every drawing set has a legend, often on its first sheet. Our drawing uses simplified symbols with its own key. Always check the legend before you read a drawing.
Practise by tracing two paths
Reading an SLD is a skill you build by tracing. Try these two on the drawing above before reading the answers.
Trace 1: What supplies the level 12 pantry socket? Start at the socket circuit at the bottom of DB-12E and go up: DB-12E, the breaker at SSB-R2 that feeds it, SSB-R2, the feeder breaker on MSB section B, the incomer, TR2, its VCB, the 11 kV switchgear, and finally the TNB ring through the metering and the RMU. The kettle's energy passes through the sub-meter on the SSB-R2 feeder, so that meter includes it.
Trace 2: What supplies the condenser water pump CDWP-1? Start at the pump's motor, the large circle marked M at the bottom left (the small M circles on the feeders are sub-meters), and go up: the starter panel, the breaker at SSB-CH, SSB-CH, the feeder breaker on MSB section A, the incomer and TR1. So a problem on TR1 or MSB section A would affect the chiller plant, while the level 12 socket, on section B, would keep its supply.
Why the single line diagram has to be kept up to date
The single line diagram is the drawing people use to isolate equipment, to find faults and to plan changes. That makes an accurate one important and a wrong one dangerous.
- When a competent person needs to isolate a board to work on it, the SLD shows which breaker supplies it. They still prove the equipment is dead at the point of work before touching it.
- When something trips at 3 a.m. and half a floor goes dark, the SLD is what you use to work out which device opened and what else it feeds.
- When a tenant asks for more power, the SLD shows the engineer which busbar and upstream breakers would carry the extra load.
In Malaysia, the drawing is a legal requirement: the laminated sheet on the wall is there because the law requires a diagram of the connections to be displayed near the switchboard.
An SLD becomes wrong when the building changes and nobody updates the drawing. A tenant fit-out adds a board, a spare breaker is put into use, or a feeder is moved to a different board. The drawing on the wall then no longer matches the building. Someone isolates the breaker the drawing names, and the circuit is still live. This is why the competent person proves dead before work, and why drawing updates belong in the building's maintenance records. If you notice a label or board that does not match the drawing, report it so that the drawing can be corrected.
Optional detail: The requirement is the Electricity Regulations 1994, Regulation 19(1)(b): "a clearly drawn diagram of the connections shall be displayed near the switchboard" (Suruhanjaya Tenaga). The symbols on real drawings are based on IEC 60617, the international standard for graphical symbols used on electrical diagrams, which is widely used in Malaysia (IEC 60617).
What comes next
You can now find every board on the drawing and follow the power to it. The labels beside the breakers are still unexplained. The next part, Circuit Breaker Types, explains the breakers and adds their ratings to this drawing. It starts from the question: what do the ratings beside each breaker mean, and why should a fault open only one breaker?
Check your understanding
- On the office tower's SLD, the bus coupler is open. If TR2's incomer opens, which boards lose their normal supply: SSB-R1, SSB-R2 or the EMSB? SSB-R2 and the EMSB's normal supply are both on MSB section B, which is fed through TR2's incomer, so they lose it. SSB-CP loses its supply too. SSB-R1 is on section A, fed from TR1, and stays on. The ATS moves the EMSB to the generator after a gap of a few seconds.
- A feeder has a CT marked 800/5, and the sub-meter measures 2.5 A from the CT. What is the current in the feeder? The ratio is 800 ÷ 5 = 160, so the feeder current is 2.5 × 160 = 400 A.
Recap: A single line diagram draws each three-phase circuit as one line, so one page shows the whole system. Read it from the top: the incoming supply, RMU and TNB metering, the ownership line, the VCBs and transformers, then the MSB busbar and the feeders that drop from it to each board. Circles on a line are CTs; the drawing's key explains the other symbols, including the capacitor bank, the generator and the ATS. The drawing is legally required near the switchboard, and it must be kept up to date, because people use it to isolate equipment.
This is Part 3 of 11 in Cobler's Building Electrical Fundamentals course. Previous: Inside the Consumer Substation: The Locked Room. Next: Circuit Breaker Types: ACB, MCCB, MCB, RCCB, RCBO.
Cobler builds CobiNeural, a platform that shows a facility team its building's energy, water and indoor air data as live numbers across the whole site. To see how your building performs, talk to us.
FAQ
Frequently asked questions
Ask us about this topic
Something in this article you want to dig into — or a situation in your own building it doesn't quite cover? Send us your question. We don't run public comments; the team replies to you directly by email.