Blog
Water Consumption Benchmark KPIs for Buildings
A water bill tells you an amount, not whether it is good or bad. Here are the KPIs that make building water manageable: per person, per occupied room, per square metre, per ton-hour of cooling, plus the baselines and alert thresholds that turn them into action.
 Tan Kok XinWater Fundamentals
Part 12 of 12 in Cobler's Water Fundamentals course. New here? See the course page.
Part 11 followed one fault in the office tower from alarm to verified repair. This last part steps back to the whole building and asks: is the building's monthly water use good or bad for a building of its size and type?
Most facility managers can tell you last month's water bill to the ringgit, but a bill is an amount, not a verdict. A water consumption benchmark turns it into one: a figure per person, per occupied room, per square metre or per unit of cooling, which you can compare with similar buildings and, more usefully, with what your own building did last month. You cannot tell whether a leak has appeared, whether a retrofit paid back or whether a tenant is being billed fairly until the raw cubic metres are divided by something that describes how busy the building was. This part shows how, and ends with a recap of the whole course and a monthly review checklist.
Why a water consumption benchmark beats a raw bill
Water bills move for ordinary reasons. Occupancy rises after a new tenant moves in. A public holiday falls mid-month. The billing period has 33 days instead of 29 because the meter reader came late. A hot, dry spell makes the cooling towers work harder. None of these is a problem, but all of them change the total. A manager who watches only the total spends much of the year chasing these changes and can miss the one month that mattered.
Dividing by the right figure fixes most of this. Divide monthly cubic metres by occupied person-days, occupied room-nights, floor area or cooling delivered, and most of the calendar and seasonal noise falls away. What remains is a number that stays flat when the building is healthy and steps up when something breaks.
Before comparing any numbers, state what sits inside the meter boundary. A building with its own cooling towers will look much worse than an identical building on district cooling, because the tower make-up passes through its meter. In the office tower, cooling tower make-up is about 1,350 of the 3,000 m³ used each month. Over a year, that is 36,000 m³ in total, or 1.2 m³ per square metre of its 30,000 m² floor area. Without the towers, domestic water alone is 19,800 m³ a year, or 0.66 m³ per square metre. Same building, two very different benchmarks. Always say which one you mean, and separate domestic water from cooling water at the meter where you can.
Offices: litres per person per day
For a typical commercial office, domestic water (toilets, pantries, cleaning and a little landscaping) is commonly in the range of roughly 30 to 60 litres per person per working day. Treat that range as illustrative, not as a target. Buildings with showers and gyms, food courts or heavy in-house cleaning sit higher. A lean fit-out with modern dual-flush WCs and sensor taps can sit lower.
For the office tower: 1,650 m³ of domestic water ÷ (1,500 people × 22 working days) = 1,650,000 litres ÷ 33,000 person-days = 50 litres per person per working day.
The denominator is the hard part. Use actual occupancy where you have it: turnstile counts, access card swipes or tenant headcounts declared under the lease. Net lettable area multiplied by an assumed density is a fallback, not a measurement, and it will hide the fact that a floor has doubled its headcount.
Hotels: cubic metres per occupied room-night
Hotels have the easiest denominator, because the hotel's booking system already counts it. Water per occupied room-night is the standard measure, and the front office can supply occupancy every morning.
As an illustrative range, mid-scale hotels often land somewhere around 0.3 to 0.8 m³ per occupied room-night. Luxury properties with large pools, spas, extensive landscaping and in-house laundry commonly exceed 1 m³. The spread is wide because the rooms are only part of the story. For a figure management can act on, split the meter into rooms, laundry, kitchens, pool and cooling towers, because each has a different fix.
Watch the shape of the curve as well as the level. In a well-run hotel, water falls with occupancy but never to zero, because kitchens, cooling, landscaping and staff areas keep running. If your low-occupancy months barely drop, the base load is too high, and that usually means leaks or plant that never stops.
What is a good water benchmark for a mall?
Malls are the hardest to benchmark, because the tenant mix drives everything. A centre anchored by a hypermarket and a large food court is very different from one full of fashion retail, and a figure per square metre reflects that mix more than it reflects good management.
Use cubic metres per square metre of gross floor area per year as the headline, but expect a wide spread and do not read much into a comparison with the mall down the road. Two internal measures are more useful: water per visitor (footfall counters make this easy) and cooling tower make-up as its own line. In most Malaysian malls, common-area toilets and cooling towers use the most water, and both can be measured separately from tenant behaviour. Tenant water should be sub-metered and recharged rather than absorbed into common-area costs, which also gives tenants a reason to fix a running tap.
Cooling towers: litres of make-up per RT-hour
Skip this section if your building has no cooling tower, for example a shoplot with split-unit (DX) air conditioning, or a building on district cooling.
Cooling is measured in refrigeration tons (RT). One RT is 3.517 kW of cooling, and one RT-hour is one RT delivered for one hour. As Part 8 explained, a cooling tower evaporates water in proportion to the heat it rejects, so its make-up water follows the cooling delivered, not the calendar. That makes litres of make-up per RT-hour a steady, physical benchmark. The RT-hours come from the chiller plant's energy meter or the building management system.
Part 8 worked out the figures: evaporation is about 6.6 litres per RT-hour, and blowdown adds more depending on the cycles of concentration, so make-up runs from about 13 litres per RT-hour at 2 cycles down to about 8.8 litres at 4 cycles (Part 8's table has the full list). Evaporation sets a floor: no tower can use less than about 6.6 litres per RT-hour.
The office tower's make-up meter read 1,350 m³ in a month when the plant delivered roughly 150,000 RT-hours. That is 1,350,000 ÷ 150,000 = 9.0 litres per RT-hour, close to the 8.8 litres expected at the tower's 4 cycles. Malaysia's climate means the towers work hard all year, so this is a steady daily cost rather than a seasonal one.
The companion measure is the cycles of concentration itself: the conductivity of the tower water divided by the conductivity of the make-up water (Part 8). Running at 3 cycles instead of 5 uses noticeably more water every day for no benefit. If nobody in the building can tell you the current cycles figure, finding it out is your first job.
Your own baseline beats any published range
Published ranges are useful as a first sanity check. After that, your own baseline is worth more, because it has no doubt about what your meters cover or what kind of building it is.
Build it from twelve months of daily data if you have it, or from three months if you are starting now. Record four things:
- The normalised daily figure (for example, litres per person per working day).
- The weekday average.
- The weekend and public holiday average.
- The minimum night flow on each meter after the tanks.
The last one is the most sensitive of the four. Night flow analysis (Part 10) explains why: a building with almost nobody in it should use very little water, and whatever it does not drop to is running 24 hours a day, billed in full and usually adding to the sewerage excess charge.
The weekday and weekend pattern tells you a lot on its own. In a healthy office, weekend use falls to a small fraction of weekday use. If Saturday looks more like Tuesday, something is running that has nothing to do with people: a suction tank float valve that no longer closes, a roof tank overfilling because its stop probe has failed, a leaking underground main, a cooling tower bleeding water continuously, or an irrigation controller nobody has checked since handover.
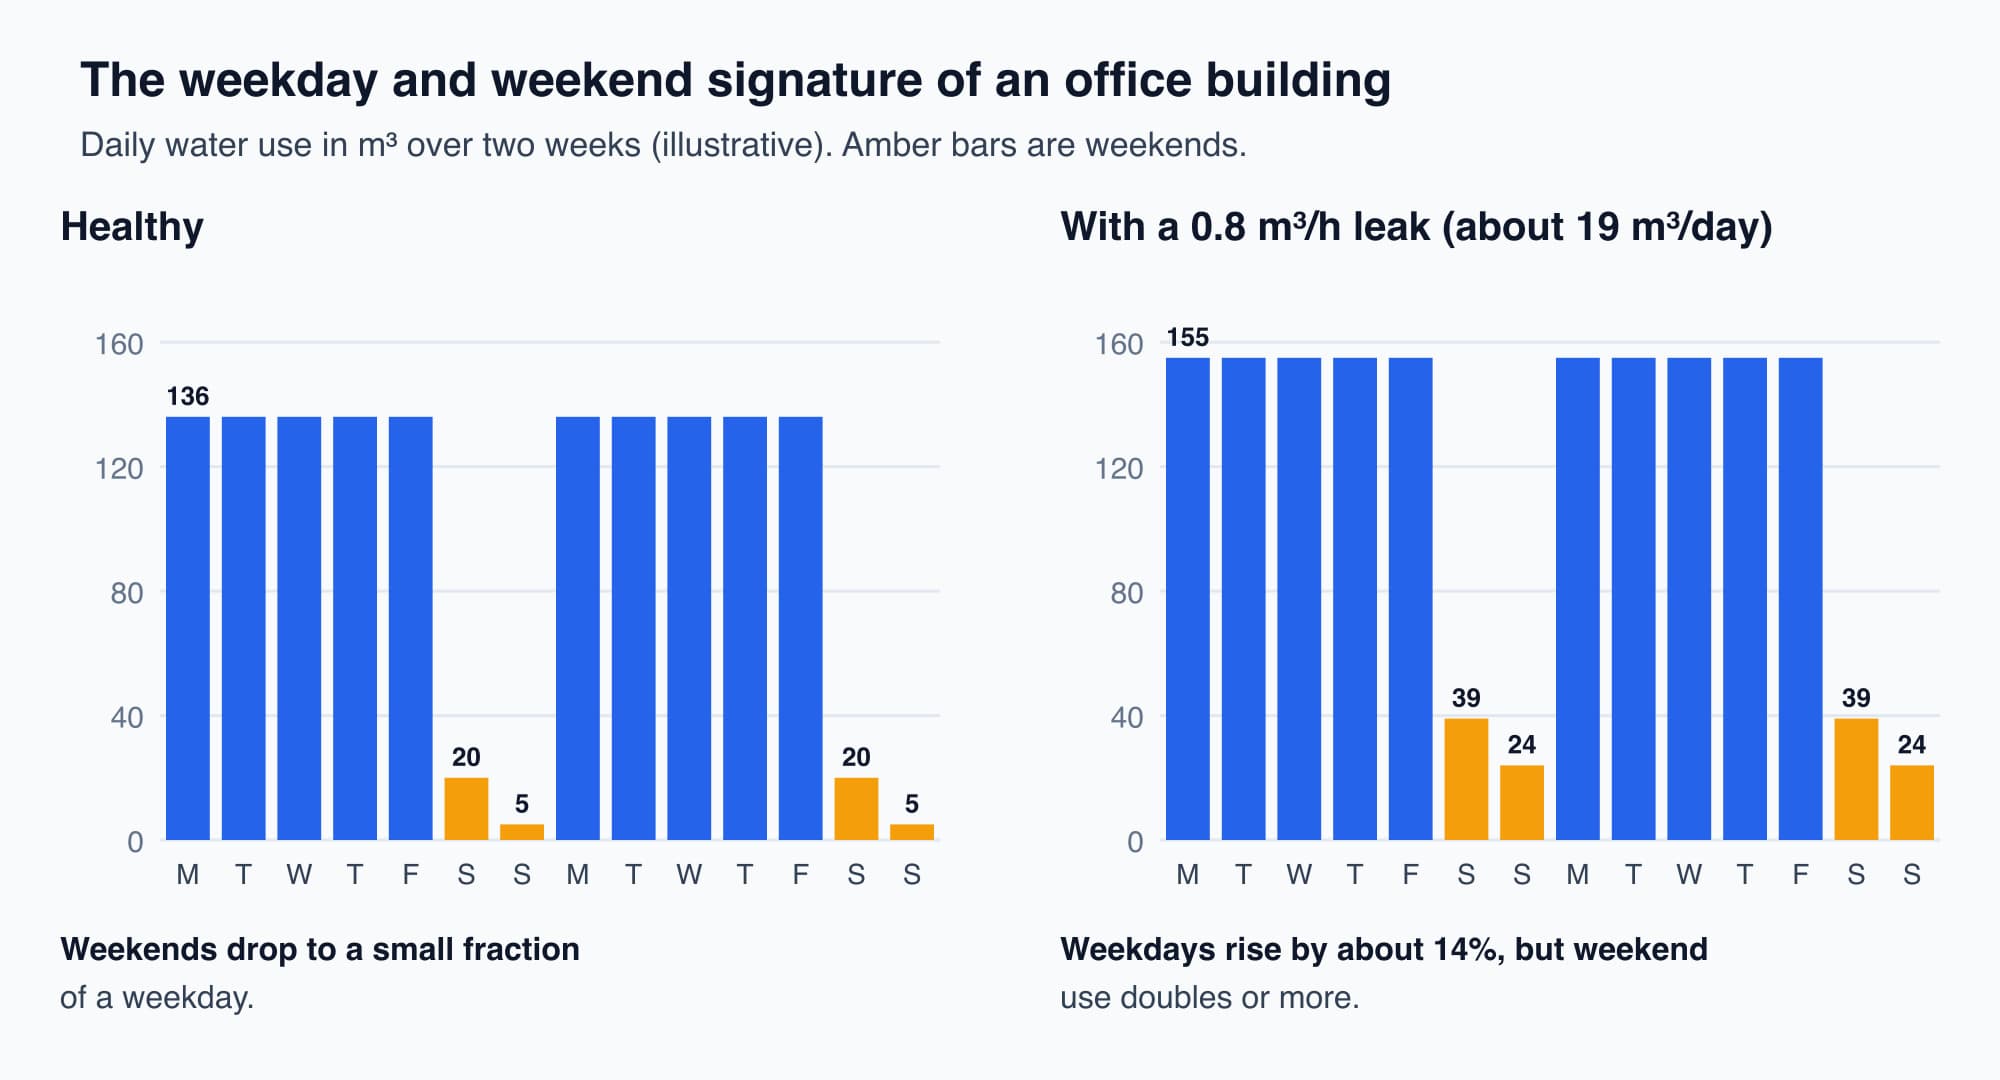
A leak adds the same amount every day, so it barely shows on a busy weekday but doubles or more the weekend figure.
What should trigger an alert?
Alerts that fire too often get ignored, and an ignored alert is worse than none. The night-flow alerts, which catch most new leaks within a day, are set up in Part 10. Two more alerts, built on the benchmarks in this part, tend to stay useful:
- Daily total above the normalised baseline by an agreed percentage for two days in a row. One day can be noise; two days is a pattern.
- A meter that should reach zero, but never does, over a whole day. This works for meters on areas with no night use, such as a vacant floor, an irrigation line or a tenant who closes at night. If it never touches zero, a valve is passing somewhere. In the Part 11 case, a meter on the vacant level 8 would have shown this.
Send these to a person who can walk to the riser and look, by WhatsApp or email, not only to a dashboard nobody opens.
Reporting water in ESG disclosures
Water is now a reported sustainability figure, not an optional extra. Listed companies in Malaysia report the total volume of water used, in megalitres (one megalitre is 1,000 m³), and landlords increasingly get the same questions from tenants who report on their own operations. The frameworks involved are named in the optional box at the end.
The frameworks want more than a total. They want the consumption, an intensity figure (the normalised benchmark from this part), and a year-on-year trend you can explain. The office tower would report about 36 megalitres a year, and should state whether that includes the cooling towers (it does). If your figures come from twelve photographed meter readings compiled by hand each quarter, you will feel it every reporting cycle, which is the pattern described in the sustainability manager's impossible spreadsheet. Daily data with a documented meter boundary makes disclosure straightforward, and it stands up when an auditor asks where the number came from.
When you put savings into a board paper, price them at the cost of one more cubic metre, not the average price on the bill. For the office tower, Part 7 showed that each cubic metre saved is worth RM4.28 (RM3.83 water plus 45 sen sewerage).
The monthly water review checklist
Everything in this course fits into one monthly routine. It takes about an hour once the meters are logging automatically.
- Read every meter and tank level at the same hour on the same date: the bulk meter, every sub-meter and every tank (Part 9).
- Check the bill against your own bulk meter reading. Note the read dates and the number of days, and flag any estimated reading (Parts 6 and 7).
- Work out the water balance with the storage correction. Compare the remainder with the last three months (Part 9).
- Review night flow for each meter after the tanks and for the storage-corrected bulk figure. Look for steps and creep. Check that every alert from the month was closed with a reason, and that every repair was verified over several nights (Parts 10 and 11).
- Update the benchmarks: litres per person per working day, make-up per RT-hour, cycles of concentration and cubic metres per square metre (this part and Part 8).
- Compare weekdays with weekends. A weekend that is rising towards weekday levels needs a walk-through.
- Check pumps and tanks: transfer pump starts per night, level alarms, and that every overflow outlet is dry (Parts 3 and 4).
- Check stored water safety records: tank inspections and cleaning are up to date (Part 5).
- Check the meters and data: any meter reading zero or a flat line, any gaps, any logger clock that has drifted (Part 6).
- Put a ringgit value on any open loss at the current tariff, and note any tariff change (Part 7).
- Write down the actions, with an owner and a date for each.
Worth knowing: A leak adds the same amount of water every day, so it barely shows on a busy weekday but can double the weekend figure or more. In a healthy office, weekend use falls to a small fraction of weekday use, which makes the weekend total one of the cheapest leak checks you have.
Optional detail: Bursa Malaysia's sustainability reporting framework includes a common indicator for listed companies: the total volume of water used, in megalitres. GRI 303, the Global Reporting Initiative's water standard, asks for water withdrawal and consumption, with context about local water stress.
The course in one page
Here is what each part taught, in one line each.
- How water reaches your tap: mains, bulk meter, suction tank, transfer pumps, roof tanks and gravity, and why Malaysian buildings store water.
- Water pressure: head and bar, pressure floor by floor, and how pressure reducing valves split a tall building into zones.
- Tanks and level controls: float valves, electrode probes and level transmitters, and overflow protection.
- Pumps: transfer and booster pumps, duty and standby, and how level controls start and stop them.
- Keeping stored water safe: potable water, air gaps and backflow, stagnation, cleaning records and who is responsible.
- Water meters: meter types, the accuracy range, and why a worn meter usually registers too little.
- The water bill: the current non-domestic tariff, the IWK sewerage basis and the cost of a small continuous leak.
- Cooling tower water: evaporation, blowdown and cycles of concentration.
- The water balance: inflow minus the change in storage, compared with the uses you can name.
- Night flow: the nightly minimum, the tank refill trap, and alerts for steps and creep.
- From alarm to verified repair: a worked leak case, and a case the data could not settle.
- Benchmarks (this part): normalised measures, your own baseline and the monthly review.
What comes next
This is the last part of the course. The best next step is to run the checklist above on your own building for the next three months, starting with twelve months of bills and one aligned set of meter readings. Most buildings find something in the first month, and it is usually something that has been running quietly for years.
If you want to understand the pumps' electricity use as well as their water, Cobler's Electricity Fundamentals course starts from the basics.
Check your understanding
- The office tower used 1,650 m³ of domestic water in a month with 22 working days and 1,500 occupants. What is its litres per person per working day, and why should it not include the 1,350 m³ of cooling tower make-up? 1,650,000 litres ÷ (1,500 × 22) = 1,650,000 ÷ 33,000 = 50 litres per person per working day. Tower make-up depends on the cooling delivered, not on how many people used the building, so it belongs in its own benchmark (litres per RT-hour). Mixing the two would make the building look worse than an identical one on district cooling.
- A cooling tower reports 5.5 litres of make-up per RT-hour. What should you suspect? That the number is wrong. Evaporation alone is about 6.6 litres per RT-hour, so no tower can use less than that. Check the make-up meter (Part 6), the RT-hour figure from the chiller plant, and whether the two cover the same period.
Recap: A water consumption benchmark divides water use by what drives it: people for offices, occupied room-nights for hotels, floor area and visitors for malls, and RT-hours for cooling towers. State the meter boundary every time. Build your own baseline from weekday, weekend and night-flow figures, and treat weekend use creeping towards weekday use as a warning. Keep alerts few and aimed at people who can act. Report total use, intensity and trend for ESG, and price savings at the current tariff. Run the monthly checklist so the course becomes a routine.
This is Part 12 of 12 in Cobler's Water Fundamentals course. Previous: From Night-Flow Alarm to Verified Repair: A Worked Leak Case.
Cobler builds CobiNeural, a platform that shows a facility team its building's energy, water and indoor air data as live numbers across the whole site. To see how your building performs, talk to us.
FAQ
Frequently asked questions
Ask us about this topic
Something in this article you want to dig into — or a situation in your own building it doesn't quite cover? Send us your question. We don't run public comments; the team replies to you directly by email.