Blog
Capstone: Following One Click
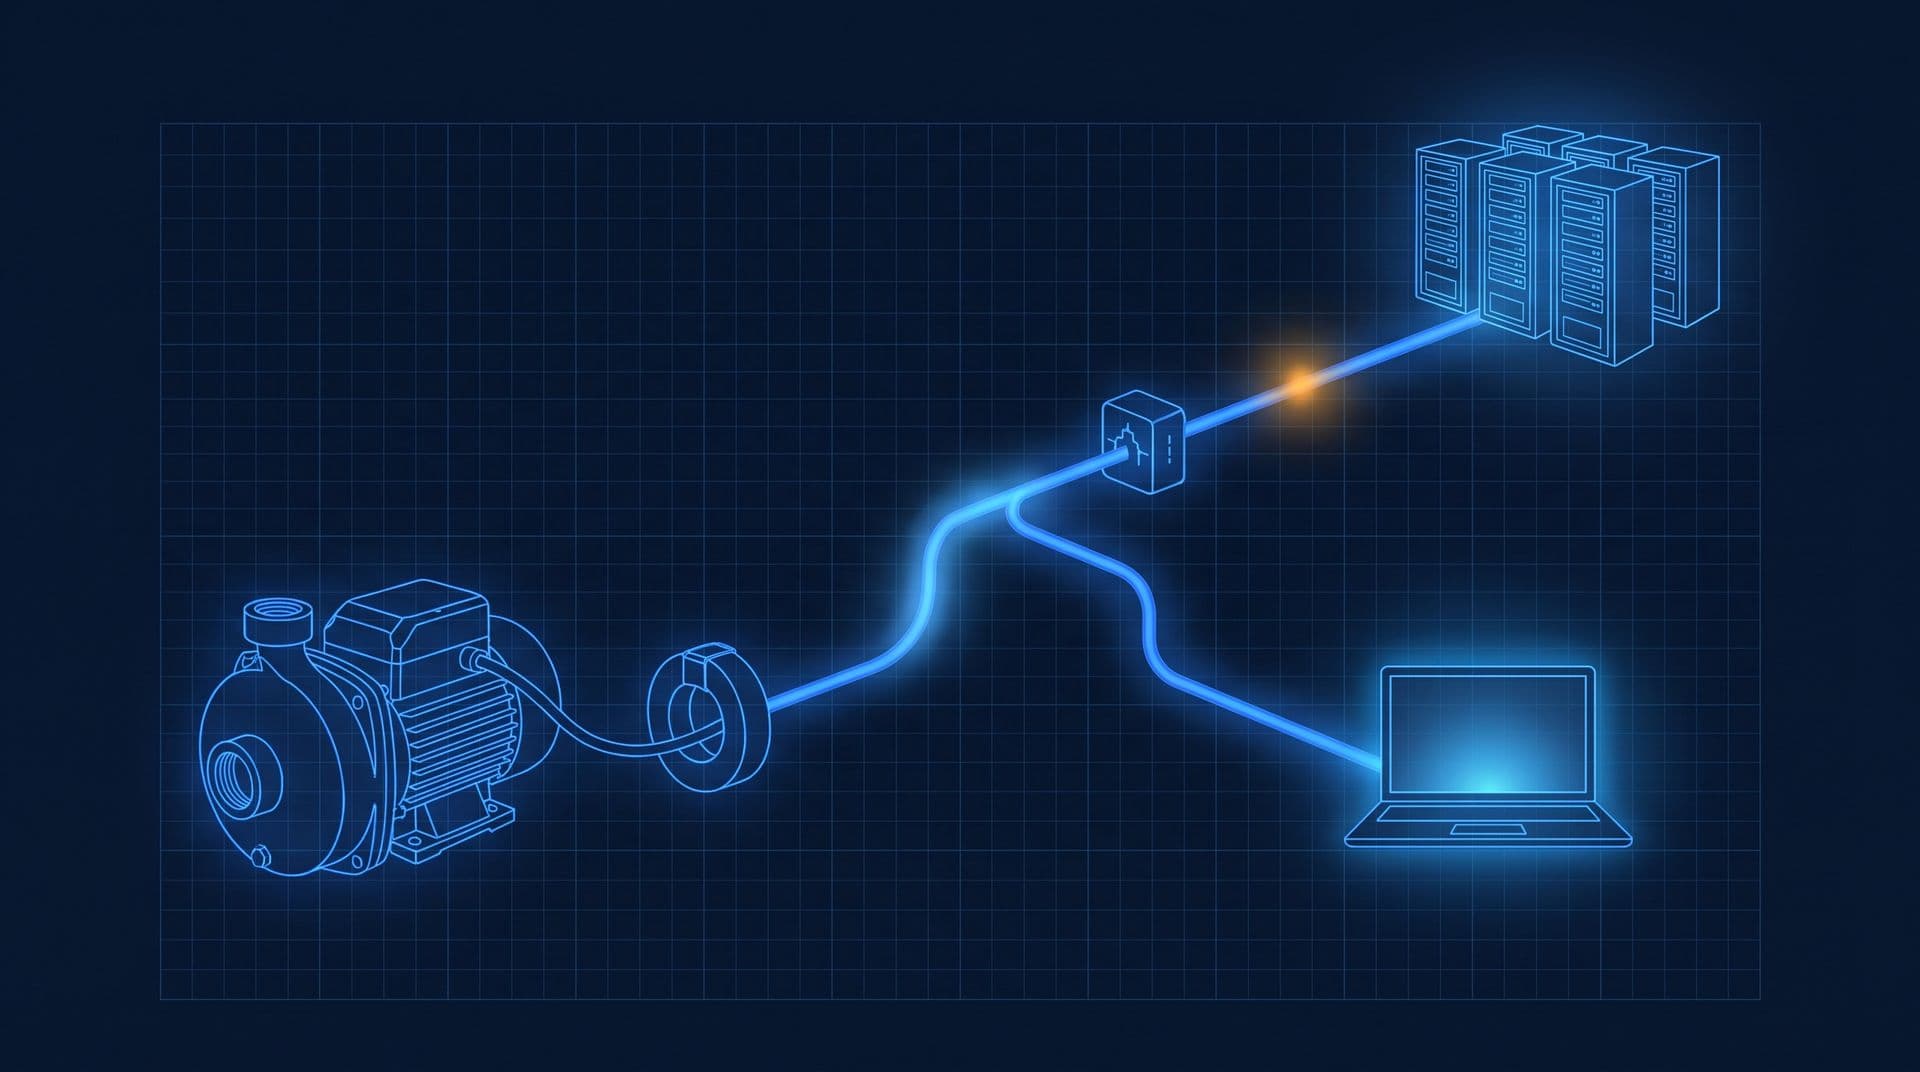
The course capstone: follow one 2 a.m. pump reading from a current transformer through a meter, Modbus and an edge gateway to a cloud fault check, then trace the 8:05 tap back from the hit test to the chart's pixels and the CCTV clip, with every link named and timed.
 Tan Kok XinHow a Computer Works
Part 13 of 13 in Cobler's How a Computer Works course. New here? Start with the course map.
It's 8:05 on Monday morning in our office tower. The facility manager taps the 2 a.m. alert about condenser water pump CWP-2, a chart of Sunday night's power draws itself, and then they press play on the plant room clip in the building's CCTV app. The course map told all that in one breath and promised we'd name every link.
Part 12 left the night's reading in the meter on CWP-2's feeder. So how does it reach a chart? That path is what people call the edge to cloud data flow, so let's walk it one link at a time.
The meter on CWP-2's feeder
It starts on the copper. A current transformer (CT) around each phase of CWP-2's feeder makes a small, safe copy of the current (Electricity Part 19). Inside the meter, an analog-to-digital converter (ADC) measures that copy and the voltage thousands of times a second, and the meter's own small processor multiplies and adds the samples into kW and kWh, using an ALU like the one in Part 3. The answers sit in its registers (Part 4), numbers at addresses once again, waiting for someone to ask. At 2 a.m. the kW register says 27.0.
The gateway at the edge
A few metres away, the gateway is doing the asking. It's a small computer with a processor, a program that loads from its flash when it powers up, an RS-485 port and a network port (Parts 5 and 6). Every 4.2 seconds it polls all 30 meters on its chain for 40 values each, as we timed in Electricity Part 22, and that comes to about 17,000 readings a minute. It stamps each reading with the time and stores it in its own flash (Part 9). Because it sits right next to the equipment, at the edge of the network, it's what we call an edge computer. In a building like ours it could be a building management system (BMS) controller or a CobiNeural gateway.
Then every so often, say once a minute (illustrative), it bundles up the new readings and sends them over the building's network and the internet line to the cloud, using the TCP from Part 10, so that nothing arrives half-finished. If the internet drops, nothing is lost. The gateway keeps polling and keeps storing, and when the line comes back it sends everything it held, oldest first.
So how long could it hold out? Say each reading takes the same 16 bytes as in Part 10, for the time, which point it is and the value (illustrative):
$$17{,}000 \times 60 \times 24 \times 16 \approx 392 \ \text{MB a day}$$
So a gateway with 16 GB of flash (illustrative) could keep about 40 days of readings before it had to drop the oldest. That's the edge's job, keeping the data safe close to where it's made, whatever the internet is doing. Edge vs cloud goes further into what belongs where.
Try it. The office internet line drops from 2:00 a.m. to 3:00 a.m., just as CWP-2 starts. What happens to the readings, and to the alert?
Show the worked answer
The gateway doesn't need the internet to poll the meters, so it keeps collecting, about 17,000 readings a minute, or roughly a million in the hour. At 16 bytes each that's about 16 MB, sitting safely in its flash.
When the line comes back at 3:00, it sends the backlog, oldest first. On a 100 megabit line, 16 MB takes about
$$\frac{16{,}000{,}000 \times 8}{100{,}000{,}000} \approx 1.3 \ \text{s}$$
So the cloud has the whole hour a few seconds after 3:00, the fault check runs on it, and the alert arrives about an hour late. But the chart at 8:05 has no gap in it.
The cloud
So where do the readings go? Well, the cloud is basically somebody else's computers. They sit in a data centre, a building full of racks of them, and each one has processors, RAM, drives and network ports like everything in this course, just thousands of them together.
There, one program takes in the gateway's batches and writes the readings into a database, a set of files on many drives arranged so that a question like "CWP-2's kW from 8 p.m. to 8 a.m." can be answered quickly. Another program runs the fault checks from Electricity Part 23 every few minutes (illustrative). For CWP-2 at 2 a.m. on Sunday night with every chiller off, its model expected about zero, and it saw 27 kW. That's far outside normal, so it raised an alert and sent a notification to the facility team by email or WhatsApp. By 6 a.m. the night had cost the 108 kWh we worked out in Part 3, by shifting 27 two places to the left.
Edge to cloud data flow
So now we have the whole trip out. A CT on the copper, a meter's ADC and processor, Modbus over RS-485 to the gateway, flash at the edge, TCP over the internet, a database on drives in the cloud, and a fault check comparing actual with expected. That's the edge to cloud data flow for one reading, and the same trip ran all night for about 17,000 readings a minute, with nobody awake to watch it.
The 8:05 tap
Now let's go the other way, from the finger to the screen (the timings are illustrative).
- The touch (Part 8). The finger slides, and the trackpad reports 12 steps right. An interrupt hands the numbers to the operating system (Part 6), which works out 640 + 12 = 652 and moves the pointer.
- The hit test (Parts 3 and 8). The tap arrives the same way. The browser's four subtractions come back 52, 48, 15 and 15, all with a top bit of 0, so the click is on Open, and the jump from Part 5 runs the button's code.
- The request (Part 10). The browser sends a few hundred bytes over the office Wi-Fi and the internet, through router after router, to port 443 on the dashboard's server.
- The query (Part 9). The server asks the database for CWP-2's night. The database's computer has its drive copy the right blocks into RAM by direct memory access (DMA), and picks out the 10,000 or so readings.
- The reply (Part 10). About 200 KB comes back in roughly 140 packets, over a few round trips of slow start, each packet numbered, ticked off and put back in order.
- The pixels (Part 7). The dashboard averages the readings into 720 one-minute points, puts the 2 a.m. to 6 a.m. shelf in columns 360 to 600 at 270 pixels up, and the graphics processing unit (GPU) draws the line into a buffer that's swapped in on the next sweep.
Adding up the waits:
Link | Built in | Time (illustrative) |
|---|---|---|
Waiting for the trackpad's next report | Part 8 | up to 8 ms |
Pointer sum, window search, hit test | Parts 3, 5, 6 and 8 | about 0.1 ms |
The request reaching the data centre | Part 10 | about 10 ms |
The database query | Part 9 | about 30 ms |
The reply, over a few round trips | Part 10 | about 85 ms |
Drawing, and the screen's next sweep | Part 7 | up to 17 ms |
Tap to chart |
| about 0.15 s |
Then they switch to the building's CCTV app, a separate program that comes with the security system, and press play. The recorder in the security room looks up 2:00 a.m. in its index and reads the key frame just before it from its disk (Part 9). The stream crosses the building's network and the firewall to the office side (Part 10), and the laptop's decoder rebuilds each frame from the one before (Part 11). The first picture of the plant room is on the screen a fraction of a second after the press (illustrative), and after that the stream keeps coming at under 2 megabits a second.
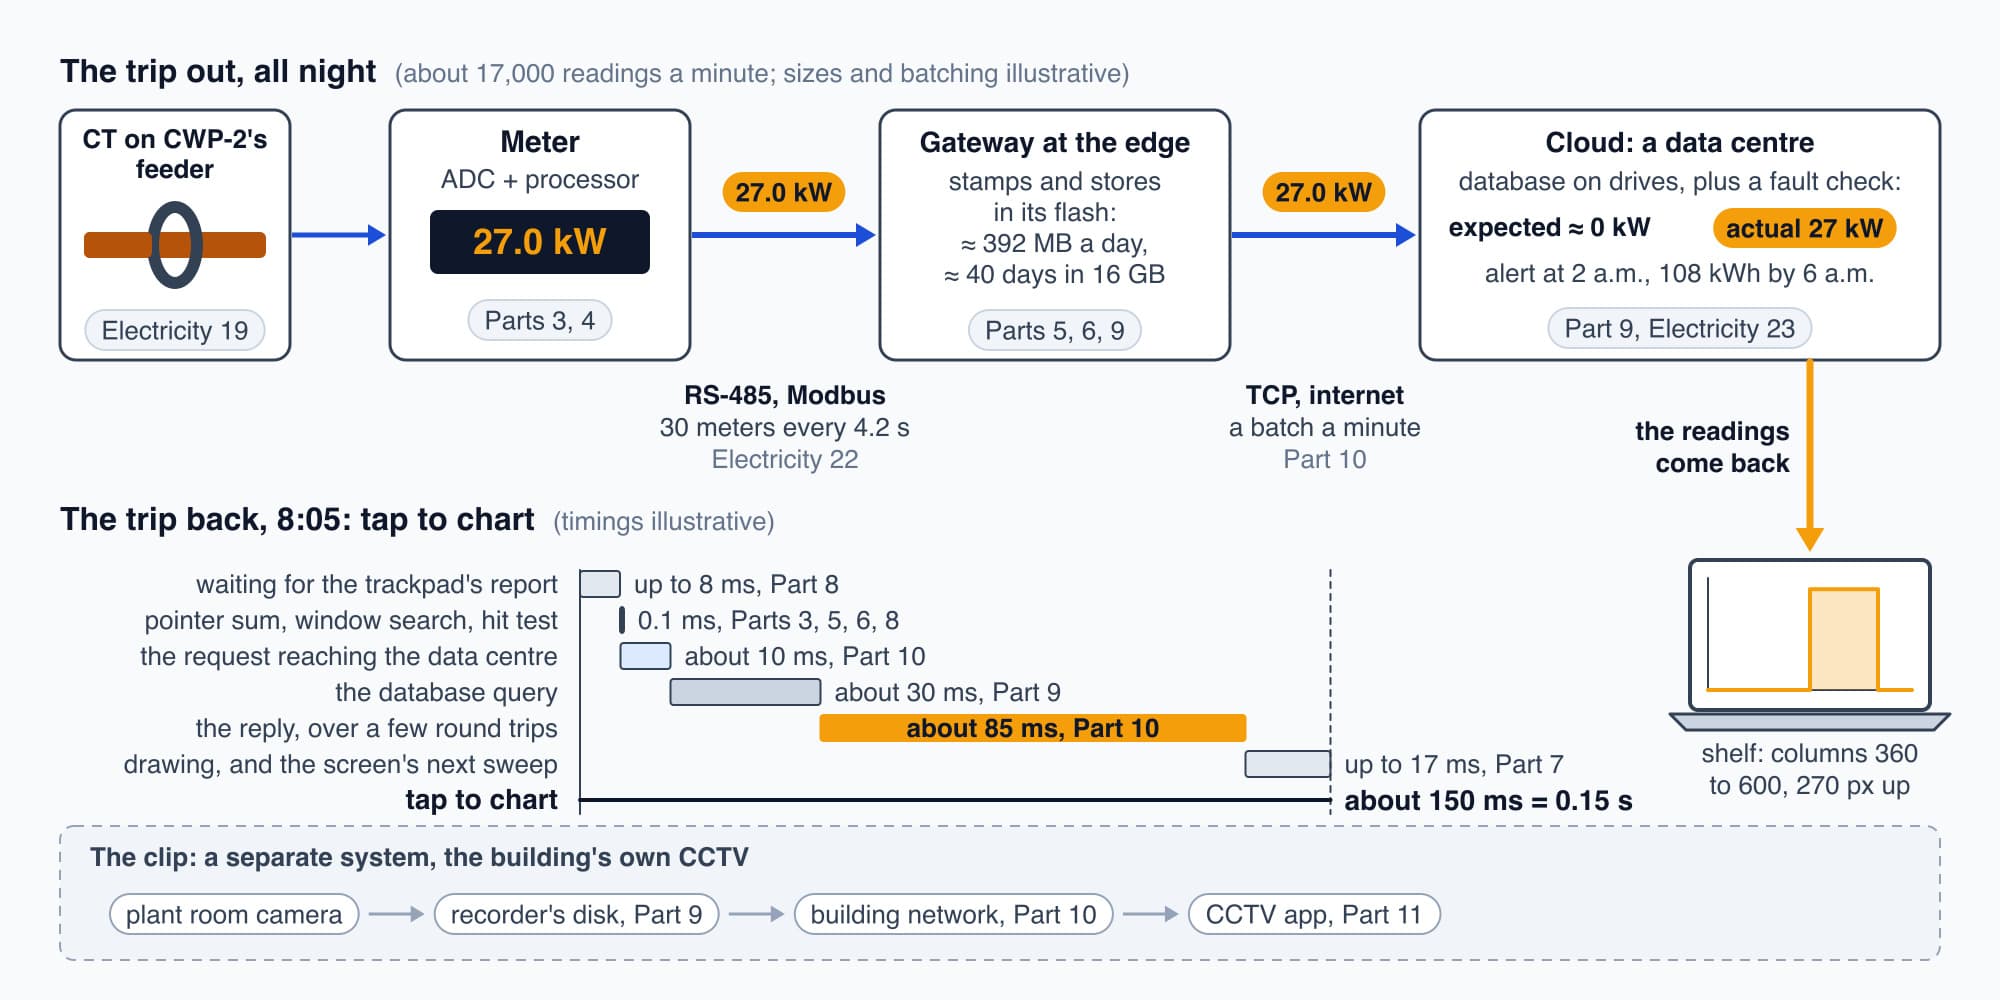
One reading, out from the copper to the cloud overnight, and back to the screen in about 0.15 seconds.
Try it. Which link in the table would you shorten first to make the chart appear faster, and why wouldn't a faster office line do much?
Show the worked answer
The reply's 85 ms is the biggest piece, and most of it is waiting on slow start's round trips from Part 10, at 20 ms each. A faster line only shrinks the 16 ms of actual sending, so doubling it saves about 8 ms.
The round trips shrink if the server is closer, so each trip is shorter, or if the reply is smaller, so slow start needs fewer rounds. Sending one point per minute instead of every 4.2-second reading would cut the reply from about 200 KB to around 15 KB, which fits in roughly the first round of packets (illustrative).
Back to 8:05
So let's tell the morning once more, slowly, with every link named. At 8:04 the facility manager pressed the power button, and the firmware, the boot loader and the operating system brought the laptop to life (Part 6). At 8:05 they tap the 2 a.m. alert, and a trackpad report, an interrupt, one sum and four subtractions find the Open button (Part 8), worked out on the adder from Part 3 and acted on by the jump from Part 5. The browser's request crosses the Wi-Fi, the office router and the internet in packets (Part 10). In a data centre, a database reads the night from its drives (Part 9), and the reply comes back in numbered packets. A chart of Sunday night's power draws itself, as numbers written into a framebuffer and swept out 60 times a second (Part 7). The readings in it were counted at 2 a.m. by a CT and a meter on CWP-2's feeder, polled by the gateway at the edge, carried to the cloud and checked against what was expected (Part 12 and this part, with Electricity Parts 19, 22 and 23). Then they press play in the CCTV app, and the recorder's disk, the building's network and the laptop's video decoder put the plant room on the screen (Parts 9 to 11).
Underneath every one of those steps sits the same small kit. Switches hold numbers (Part 1), gates make decisions (Part 2), an adder does the sums (Part 3), memory keeps them (Part 4), and a processor steps through a list of instructions (Part 5). And to every processor along the way, in the meter, the gateway, the servers in the cloud and the laptop, the outside world was more memory. The trackpad, the drives, the network and the screen were all numbers at addresses. And the part the facility manager actually waited for, from the tap to the chart, took about 0.15 seconds.
At the start of the course we said that not long ago, a pump like CWP-2 running all night would only have been caught on a night round, or on a bill weeks later. Now, by the time the facility manager walks down to the plant room, they already know that CWP-2 ran for four hours with nothing to cool, that it used 108 kWh doing it, and what the room looked like while it ran. Nobody had to be in the plant room at 2 a.m. for any of that. The computers did the watching, all night, at every link, and the facility team gets the morning for finding out why the pump ran and making sure it doesn't again. (The alert and the chart in this story come from CobiNeural, which Cobler builds, and the clip from the building's own CCTV system, but the chain underneath is the same for any system that reads a building.)
Where next
So where do you go from here? If one link still feels hazy, go back to the part it names. If you'd like to follow the building side further, the Electricity Fundamentals course starts from the electrons in the copper and ends at this same tower's fault list, and the Building Automation and BMS Fundamentals course on Cobler Learn goes into the controllers, sequences and alarms. And BMS trends, alarms and dashboards is a good next read on the screens an operator actually works from.
This is Part 13 of 13 in Cobler's How a Computer Works course. Previous: Building Controllers: PLCs and DDC. Next: How a Computer Works: Start Here.
Cobler builds CobiNeural, which reads a building's meters and controllers through a gateway at the edge, checks them in the cloud and puts alerts like CWP-2's in front of the right person. To see it on your own site, request a demo.
FAQ
Frequently asked questions
Ask us about this topic
Something in this article you want to dig into — or a situation in your own building it doesn't quite cover? Send us your question. We don't run public comments; the team replies to you directly by email.