Blog
Building Electrical Distribution
Part 18 opens Act 3 by following a building's power from the 11 kV intake through the transformer, main switchboard, risers and distribution boards to one pantry kettle, working out the current, the fault level and the maximum demand on the way.
 Tan Kok XinElectricity Fundamentals
Part 18 of 23 in Cobler's Electricity Fundamentals course. New here? Start with the course map.
Let's stay in the 20-storey office tower from Part 17 and switch on the kettle in its level 12 pantry. It draws 13 A. If we follow that current back towards the street, it passes through three switchboards, at least four breakers and a transformer before it reaches the 11 kV room in the basement. Each breaker on the way is bigger than the one below it. That path, repeated for every light, socket, pump and chiller, is what we call building electrical distribution.
We know from Part 13 how the grid's 11 kV gets to the building's door. And Part 17 left us wanting to see and control electricity inside one building, so before we measure anything, we need the map. Every piece on it is something we've already built: the transformer, the breaker, three-phase power and the circuit. What we haven't seen yet is how they fit together.
Building electrical distribution
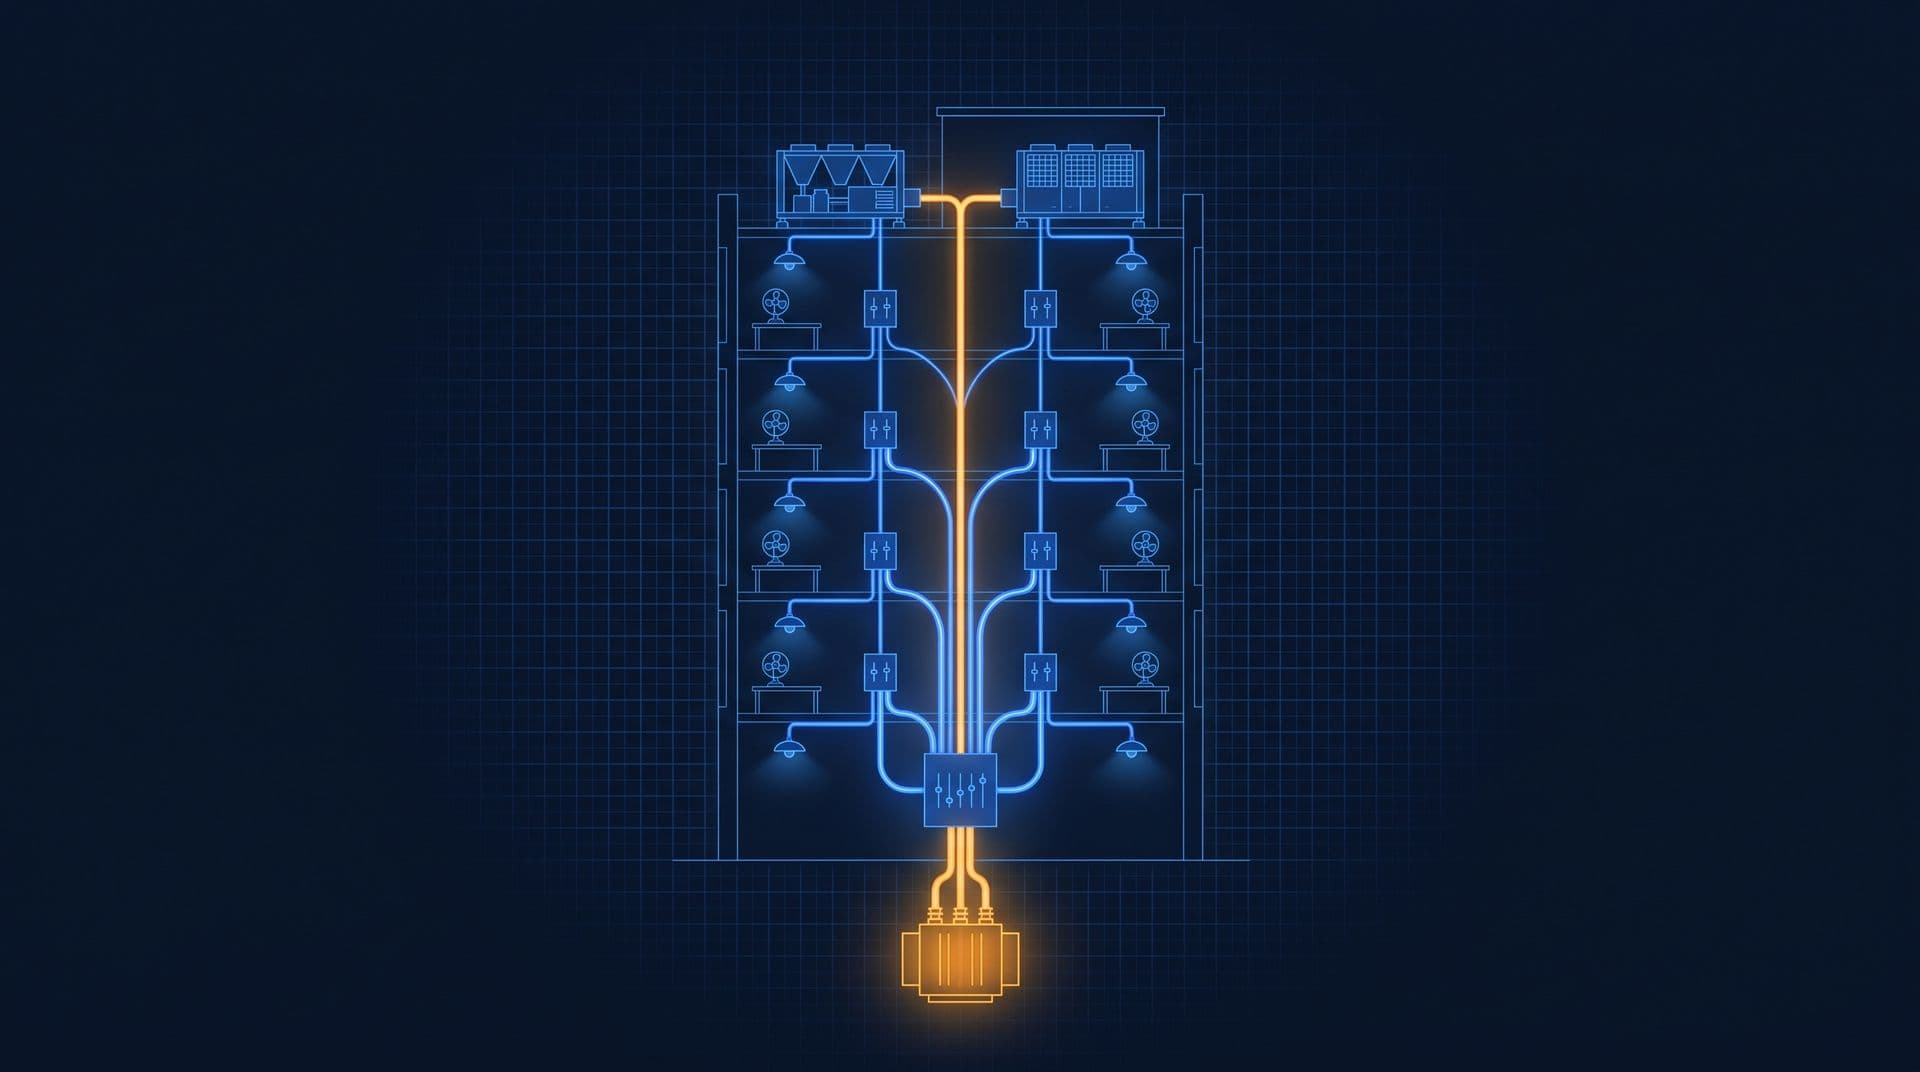
So how do we go from one board of circuits to a tower with hundreds of them? Well, what if we split the supply in stages, like a tree, with each split close to the loads it feeds?
The trunk is where the transformer's output lands, and we call that the main switchboard (MSB). Its branches are sub-switchboards (SSBs), and each one feeds one area, like a riser serving ten floors, the chiller plant or the lifts. The twigs are distribution boards (DBs), the grey box you'll find on each floor. And the leaves are the final circuits, such as one row of lights or one run of sockets. So building electrical distribution is basically a tree of switchboards, cables and breakers, carrying power from a building's single supply point to every final circuit and splitting it into smaller branches at each level.
But why a tree, and not one big board? Well, there are three reasons, and they all come from earlier parts. First, each split sits near its loads, so the long cables are few and fat while the many short ones are thin. That saves copper and keeps the voltage drop of Part 3 small. Second, a fault can be cut off at the nearest split while the rest keeps running. And third, one branch can be switched off for work while the building carries on. MSB, SSB and DB in the Building Electrical course covers the boards themselves. Here we're just following the electricity through them.
From 11 kV to 400 V
Let's start at the root. The 11 kV cable from TNB (Tenaga Nasional Berhad) enters the consumer substation, which is a locked room at ground or basement level. In there, TNB's revenue meter measures the whole building through instrument transformers that scale the current and voltage down, and the current kind is what we'll look at in Part 19. Next comes the building's 11 kV breaker, and then the building's own transformer, which trades voltage for current exactly as in Part 9. It steps 11 kV down to 400 V three-phase, which is 230 V between each phase and neutral, as Part 10 showed. Inside the Consumer Substation walks the room.
Now trading voltage for current has a price on the low side. Transformers are rated in kVA, the apparent power of Part 12. For a 1,500 kVA transformer, the full-load current at 400 V is:
$$I = \frac{S}{\sqrt{3} \times V} = \frac{1{,}500{,}000}{1.732 \times 400} \approx 2{,}165 \text{ A}$$
That's over 160 pantry kettles' worth of current on each phase. On the 11 kV side, the same power needs only about 79 A. So the current jumps 27-fold, and that's why the transformer sits as close to the loads as it can, because the \(I^2 R\) losses of Part 3 add up along every metre of 400 V cable.
At the MSB, those 2,165 A land on copper busbars. That's the free-electron sea of Part 1 again, just in bars thick enough to carry that current without overheating. The incoming breaker is the biggest low-voltage breaker in the building, and we call it an air circuit breaker (ACB).
Breakers and selectivity
Now every level of the tree has its own breaker, and to see why, let's think about a short circuit. A short right at the MSB is limited almost only by the transformer itself. IEC 60076-5, the transformer standard of the International Electrotechnical Commission (IEC), gives 6 percent as the minimum impedance (the alternating-current version of resistance) for transformers of this size (IEC 60076-5). That means just 6 percent of the rated voltage pushes full-load current through the windings. By Ohm's law, the full voltage behind a short pushes about 1 ÷ 0.06 ≈ 17 times as much:
$$I_{\text{fault}} \approx \frac{I_{\text{full load}}}{Z} = \frac{2{,}165}{0.06} \approx 36{,}000 \text{ A}$$
That's the same 36,000 A we met at the end of Part 13. It's an upper estimate, before the grid's and the cables' own impedance are counted, and it's why the ACB is rated to break tens of thousands of amps. Down at a floor DB, the long cable in between adds resistance (\(R = \rho L / A\), Part 3), so the possible fault current there is far smaller. The designer checks the fault level at each board, and at the twigs it's usually low enough for palm-sized miniature circuit breakers (MCBs), which are commonly rated to break 6 or 10 kA. In between, moulded-case circuit breakers (MCCBs) guard the feeders (Circuit Breaker Types sorts the family).
Every one of these breakers uses the two trips from Part 14. A thermal trip, where \(I^2 R\) heat bends a bimetal strip, handles slow overloads. A magnetic trip, where the coil of Part 6 yanks the latch, handles short circuits.
So the current a fault can drive is largest at the trunk and smallest at the twigs. And each breaker has to protect the cable it feeds, and open before the one above it. If the kettle has a fault, we want just its pantry circuit to trip, and not the whole floor or the building. So the breakers are graded so that the one nearest a fault opens first. We can lay it out case by case, by where the fault is:
- In the kettle's circuit: its breaker at the floor DB opens. The rest of the floor stays on.
- On the cable to a floor DB: the breaker feeding it opens. That one board goes dark.
- On a riser feeder: its breaker at the MSB opens. Ten floors go dark.
- On the MSB busbar: the ACB opens, and everything on that busbar goes dark.
That's what engineers call selectivity. At the twigs, residual current devices add Part 14's 30 mA protection for people.
Three-phase and single-phase loads
So which loads get which supply? Well, big machines take all three phases and small loads take one, because that's how Part 10 and Part 11 shared out the work.
Chillers, pumps, cooling towers, AHU (air handling unit) fans and lifts run on 400 V three-phase motors, and many of them are on the variable speed drives (VSDs) of Part 15. They get their own feeders from the MSB or a plant SSB. Lighting, sockets and small fan coil units run on 230 V single-phase.
A DB connects each single-phase circuit to L1, L2 or L3 in turn, so the three phases carry similar loads. Inside each circuit, the lamps and sockets are wired in parallel, as in Part 4, so each one gets the full 230 V and their currents add up at the DB. And the shared neutral is where the triplen harmonics of Part 16 pile up.
There are two more pieces hanging off the trunk. A capacitor bank at the MSB corrects the power factor, as in Part 12. And some loads have to stay alive in a blackout, like fire pumps, emergency lighting and at least one lift. They sit on an essential section, often its own emergency main switchboard (EMSB). An automatic transfer switch (ATS) can move that section onto the standby generator of Part 7, while the UPS (uninterruptible power supply) from Part 17 bridges the seconds for the servers (When the Mains Fails).
Single line diagrams
So how do engineers draw all of this? They use one sheet that draws each three-phase run as a single line, so the whole tree fits on a page, and that's why we call it a single line diagram (SLD). The incomer sits at the top, and the MSB busbar is a thick horizontal bar. Each line dropping from it is one feeder, labelled with its breaker rating and cable size. You'll also see small circles marked with ratios such as 1500/5. Those are current transformers, and they're the points where the tree can be measured. How to Read a Single Line Diagram teaches the symbols.
From the 11 kV room to DB-12E
Here's the office tower this course keeps coming back to, traced from the street to the pantry (the feeder figures are illustrative).
TNB's 11 kV cable and revenue meter sit in the basement substation. Two 1,500 kVA transformers each feed one half of the MSB through their own ACB. Why two, and not one big one? Well, if one fails or is shut down for maintenance, only half the board loses supply. And each half faces the fault current of one transformer, the 36,000 A we estimated above, rather than both at once, so its breakers and busbars can be rated lower.
From the MSB, feeders run to the chiller plant, to a riser switchboard for levels 1 to 10, to another for levels 11 to 20, to the lifts, and to the pumps, car park and services. The upper riser switchboard feeds the DBs on each floor through its rising main. On level 12, the east half's board is DB-12E, and on it a 20 A RCBO (an MCB and a 30 mA residual current device in one) protects the pantry circuit. And that's where our kettle is, drawing 3,000 ÷ 230 ≈ 13 A.
So where does all the energy go? A study of Malaysian office buildings found that air conditioning used 57 percent of the electricity, lighting 19 percent, lifts and pumps 18 percent and other equipment 6 percent (Saidur, 2009; see also why air conditioning tops the bill). Now you'd expect the tower's maximum demand to be its feeders' peaks added up. But if we put the numbers side by side, it comes out lower, and that matters for the bill:
MSB feeder (illustrative) | Its own peak | At the building's 3 pm peak |
|---|---|---|
Chiller plant | 720 kW | 700 kW |
Riser, levels 1 to 10 | 380 kW | 350 kW |
Riser, levels 11 to 20 | 400 kW | 370 kW |
Lifts | 150 kW | 80 kW |
Pumps, car park and services | 130 kW | 100 kW |
Total | 1,780 kW | 1,600 kW |
The feeders' own peaks add up to 1,780 kW, but they never all land in the same half-hour. The building's maximum demand, from Part 5, is the highest 30-minute average of the whole tree together, which here is 1,600 kW. On an 11 kV supply, capacity and network charges of RM89.27 per kW (General tariff) or RM97.06 per kW (Time-of-Use) turn that into about RM143,000 to RM155,000 a month (connected load vs maximum demand explains the gap between ratings and peaks).
One meter for the whole tree
Now TNB's meter sits at the root of the tree and sees all of it as one number. It can tell us the tower peaked at 1,600 kW at 3 pm. But it can't tell us whether the chiller plant or the upper riser pushed it there. It also can't tell us if a pump ran all night, or which floor's lights stayed on over the weekend. And if we can't see what each branch is doing, we can't really manage it. Right now the tree is a set of busbars carrying hundreds or thousands of amps with no numbers on them.
So how do we put a number on each branch? We'd need to measure currents of 2,000 A or more on live copper, without cutting into it, and without bringing that current anywhere near a person or a meter. Part 19 shows how a ring of iron and a coil of thin wire do exactly that.
This is Part 18 of 23 in Cobler's Electricity Fundamentals course. Previous: Batteries and Energy Storage. Next: Current Transformers and Power Meters.
Cobler builds CobiNeural, which puts live readings from every metered branch of that tree on one screen, so the feeder behind each peak has a name. To see your own building's tree, talk to us.
FAQ
Frequently asked questions
Ask us about this topic
Something in this article you want to dig into — or a situation in your own building it doesn't quite cover? Send us your question. We don't run public comments; the team replies to you directly by email.